


 Major Pairs Action Bias: USDCAD and USDCHF Stand Out as Extremely Bullish While GBPUSD and NZDUSD Turn Extremely Bearish
  FxWirePro: NZD/USD edges lower, remains on back foot
  FxWirePro: GBP/NZD maintains bersish bias with focus on 2.2900 level
  FxWirePro: GBP/USD edges higher as traders await BoE guidance and UK fiscal clarity
  Crypto Action Bias: ETHUSD Stands Out as the Bullish Pair to Watch
  JPY Pairs Action Bias: EURJPY Leads as Bullish Standout Amid Mixed Momentum
  FxWirePro- Woodies pivot (Major)
  FxWirePro: USD/JPY eases ahead of Fed decision , Intervention risks linger
  FxWirePro: USD/ CNY remains soft ahead of Fed decision
  FxWirePro- Major Pair levels and bias summary
  FxWirePro : USD/JPY holds relatively bid on 163 ahead Of FOMC,BoJ meetings
  EUR/JPY Holds Bullish Bias as Euro Extends Recovery
  FxWirePro: EUR/NZD up trend gains momentum but hurdles ahead
  FxWirePro: NZD/USD neutral in the near-term, scope for downward resumption
  FxWirePro: EUR/ AUD gains some ground , but remains on bearish path


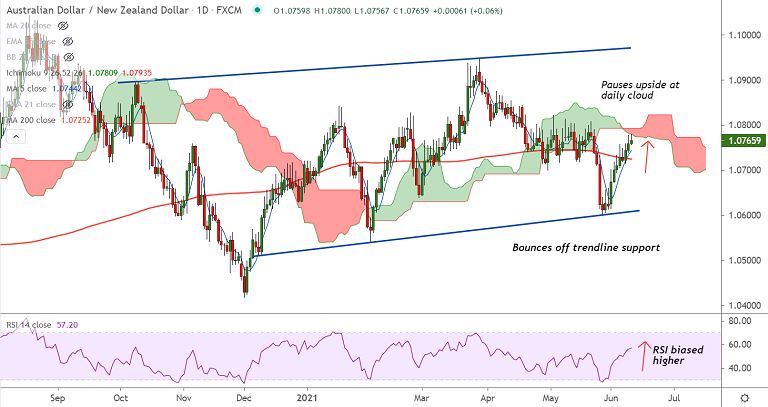
AUD/NZD chart - Trading View
Technical Analysis: Bias Bullish
- AUD/NZD was trading 0.13% higher on the day at 1.0773 at around 10:00 GMT
- The pair is extending 200-DMA breakout and is testing cloud resistance
- Momentum with the bulls, Stochs and RSI are strongly bullish, RSI well above the 50 mark
- MACD shows bullish crossover on signal line, supporting upside in the pair
- Price action has shown a decisive break above 200W MA and weekly cloud
- Volatility is high and rising as evidenced by widening Bollinger bands
Support levels - 1.0742 (55-EMA), 1.0725 (200-DMA), 1.0716 (20-DMA)
Resistance levels - 1.0821 (Previous week high), 1.09, 1.0951 (110-month EMA)
Summary: AUD/NZD trades with a bullish bias. Breakout above cloud will propel the pair higher. Bullish invalidation only below 200-DMA.


