


 FxWirePro: NZD/USD edges lower, remains on back foot
  NZDJPY Pullback: Sell Rallies Toward 93.30 as Yen Weakness Eases
  FxWirePro: EUR/AUD outlook weaker on renewed downside pressure
  FxWirePro- Major Pair levels and bias summary
  FxWirePro: AUD/USD dips after RBA Governor speech
  FxWirePro: GBP/NZD maintains bersish bias with focus on 2.2900 level
  NZD/JPY Flatlines Near 94.60: Will Key Support Reignite the Uptrend?
  FxWirePro: GBP/AUD downside pressure builds, key support level in focus
  FxWirePro : USD/JPY holds relatively bid on 163 ahead Of FOMC,BoJ meetings
  FxWirePro: USD/ZAR retreats but trend is still bullish
  JPY Pairs Action Bias: EURJPY Leads as Bullish Standout Amid Mixed Momentum
  FxWirePro: GBP/AUD gains some upside momentum but still bearish
  FxWirePro: AUD/USD falls after softer-than-expected Australian Q2 CPI
  Major Pairs Action Bias: USDCAD and USDCHF Stand Out as Extremely Bullish While GBPUSD and NZDUSD Turn Extremely Bearish
  Crypto Action Bias: ETHUSD Stands Out as the Bullish Pair to Watch
  FxWirePro: USD/CAD runs out of steam but maintains bullish outlook


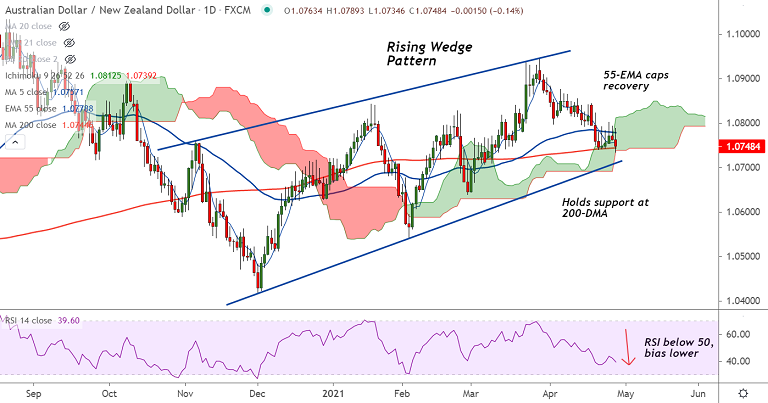
AUD/NZD chart - Trading View
Technical Analysis: Bias Bearish
- AUD/NZD was trading 0.16% lower on the day at 1.0746 at around 08:20 GMT
- Oscillators support weakness, Stochs and RSI are biased lower, RSI is well below 50 mark
- GMMA indicator shows major trend is neutral, while minor trend has turned bearish
- Recovery attempts in the pair capped at 21-EMA, stiff resistance seen till 1.08 mark
- The pair trades pivotal at 200-DMA support, break below will open downside
Support levels - 1.0744 (200-DMA), 1.0710 (Rising trendline), 1.0682 (50% Fib)
Resistance levels - 1.0778 (55-EMA), 1.0789 (21-EMA), 1.08 (20-DMA)
Summary: AUD/NZD trades with a bearish bias. Price action pivotal at 200-DMA support. Breach below will plummet prices. Scope for dip till 61.8% Fib at 1.0620.


