
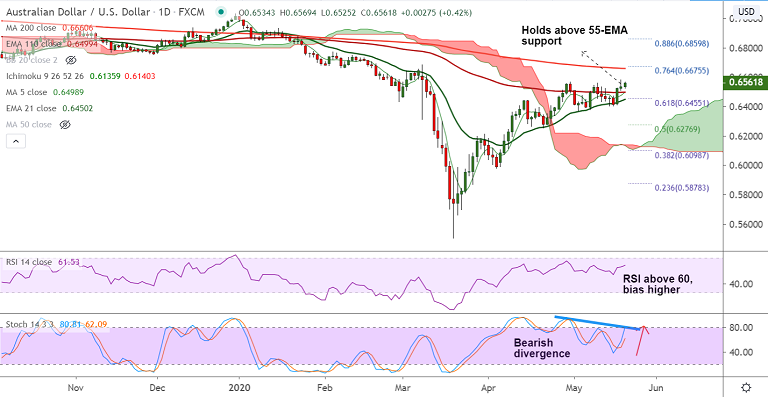
AUD/USD chart - Trading View
Technical Analysis: Bias Bullish
GMMA Indicator:
- Major Trend: Turning bullish
- Minor Trend: Strongly bullish
Ichimoku Analysis:
- The pair is extending gains above daily cloud
- Minor pullbacks have bounced off Kijun Sen
Oscillators:
- RSI is above 60 with room to run further
- Stochs are biased higher, momentum bullish
- Bearish divergence on Stochs and RSI could dent upside
Bollinger Bands:
- Bollinger Bands are shrinking on the daily charts, volatility is low
- Upside capped at upper Bollinger band with 'Doji' formation on Tuesday's candle
High/Low:
- Previous Week High/Low - 0.6561/ 0.6402
- Previous Session High/Low - 0.6584/ 0.6509
Major Support Levels: 0.6499 (110-EMA), 0.6450 (21-EMA), 0.6417 (55-EMA)
Major Resistance Levels: 0.6579 (Upper BB), 0.6660 (200-DMA), 0.6675 (76.4% Fib)
Summary: Technical indicators are supportive of upside in the pair. But 'Bearish Divergence' on oscillators might dent upside. FOMC minutes will be crucial for further direction. Markets will watch for hints to economic and rate projections. Any new clues on negative rates could dent the USD, pushing the pair higher.


