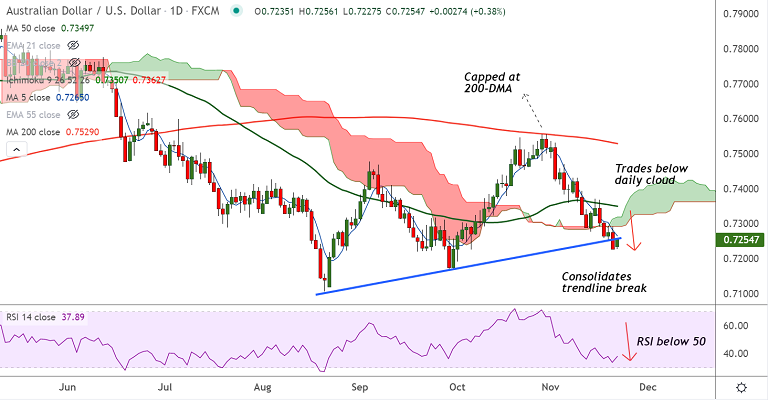
Chart - Courtesy Trading View
Technical Analysis:
GMMA Indicator
- Major and minor trend are strongly bearish
Ichimoku Analysis
- Price action is consolidating break below daily cloud
Oscillators
- Momentum is strongly bearish
- Stochs are at oversold levels, scope for some pullback
Bollinger Bands
- Volatility is high and rising as evidenced by widening Bollinger bands
Major Support Levels: 0.72, 0.7194 (200-week MA), 0.7189 (Lower BB)
Major Resistance Levels: 0.7265 (5-DMA), 0.7304 (200H MA), 0.7313 (110-week EMA)
Summary: AUD/USD was trading with a bearish bias. Recovery attempts lack traction. Dip till 200-week MA at 0.7194 likely.


