


 FxWirePro: GBP/AUD downside pressure builds, key support level in focus
  FxWirePro- Woodies pivot (Major)
  FxWirePro: USD/CAD positions for another climb, eyes 1.4150 level
  FxWirePro- Major Crypto levels and bias summary
  JPY Action Bias: Bullish Pairs to Watch Out For
  FxWirePro- Major Crypto levels and bias summary
  FxWirePro: GBP/AUD under pressure as pound continues to weaken
  FxWirePro: USD/ZAR uptrend loses steam, remains on bullish path
  FxWirePro: AUD/USD gains on Iran-US truce hopes, risk rally
  FxWirePro: EUR/NZD downside pressure builds, key support level in focus
  GBPJPY Slips After Sterling Weakness, Bears Eye 216
  FxWirePro: GBP/NZD downside pressure builds, key support levels in focus
  FxWirePro :USD/JPY eases slightly, remains on bullish path
  FxWirePro: EUR/NZD up trend gains momentum but hurdles ahead
  FxWirePro: USD/CAD gaining momentum for a move towards 1.4200 level
  AUDJPY Action Bias: Bullish Dip-Buy Setup Despite Flat Neutral Bias


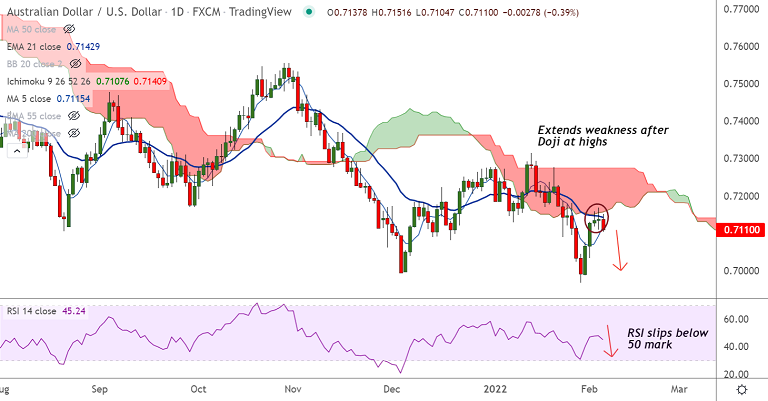
Chart - Courtesy Trading View
Spot Analysis:
AUD/USD was trading 0.41% lower on the day at 0.7109 at around 08:50 GMT.
Previous Week's High/ Low: 0.7187/ 0.6967
Previous Session's High/ Low: 0.7168/ 0.7109
Fundamental Overview:
The Australian dollar came under some selling on Friday after RBA minutes indicated a patient approach.
The Reserve bank of Australia, in the Statement on Monetary Policy (SoMP) earlier on Friday, said that the board is prepared to be patient amid significant uncertainties surrounding the inflation outlook.
On the other hand, the US dollar remains volatile as market participants await the release of the US monthly jobs data.
US NFP is expected to show that the economy added 150K jobs in January, down from the 199K reported in the previous month.
Any disappointment in data would weigh on the already weaker USD and support the pair higher.
Technical Analysis:
- Upside in the pair has been capped at 12-EMA and daily cloud base
- Back-to-back Spinning top and Doji formations at highs keeps scope for downside
- The pair is trading shy of 200H MA support on the intraday charts
- RSI has turned and is below the 50 mark. MACD and ADX support downside
Major Support and Resistance Levels:
Support - 0.7097 (200H MA), Resistance - 0.7143 (21-EMA)
Summary: AUD/USD bias remains bearish as long as pair holds below 21-EMA resistance. Watchout for break below 200H MA for further weakness.


