


 FxWirePro- Woodies pivot (Major)
  FxWirePro: USD/ZAR gains as stronger dollar outweighs upbeat South Africa's trade surplus
  FxWirePro- Major Crypto levels and bias summary
  Nikkei Surges Past 65,000 on Suspected Yen Weakness: Tech Giants Like Advantest and NEC Lead Explosive Gains
  FxWirePro: AUD/USD gains some ground but outlook is bearish
  FxWirePro: GBP/USD rises as soft US data pressures dollar
  FxWirePro: EUR/ AUD dips below 1.6400 level, focus on near term support
  FxWirePro: GBP/NZD remains weak, eyes 38.2%fib support
  Major European Indices Score Extremely Bullish: DAX Eyes 26000, CAC Targets 8600, FTSE100 at 11000 – Key Levels to Watch
  FxWirePro- Major Pair levels and bias summary
  AUDJPY Volatile After Massive Sell-Off: Sell Rallies at 113, Targeting 110 as Bearish Momentum Surges
  NZDJPY Retreats on Yen Strength – Bearish Setup Targets 90 After Hitting 92.75 Low
  FxWirePro: GBP/NZD remains weak, eyes 38.2%fib support
  FxWirePro:USD/JPY climbs back above 160.00 after BOJ rate decision
  FxWirePro: GBP/AUD bears maintain upper hand
  FxWirePro: NZD/USD consolidates overnight gains, but loses momentum


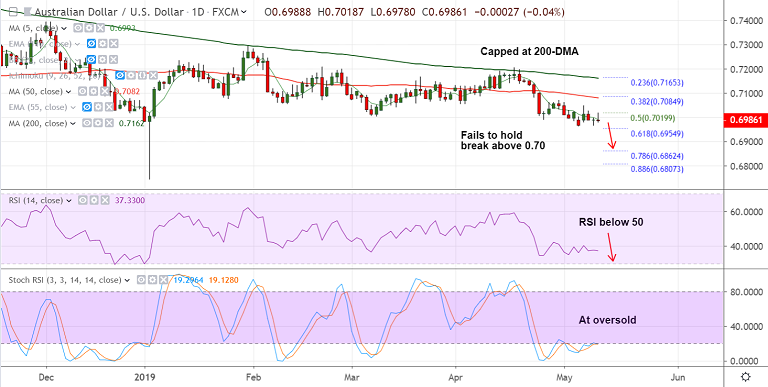
AUD/USD chart - Trading View
- The Aussie shrugs-off the RBA SoMP, edges higher as markets eye US-China trade negotiations.
- The Reserve Bank of Australia (RBA), in its latest Statement of Monetary Policy (SoMP), downgraded Australia's growth and inflation outlook.
- The central bank has cut June 2019 GDP forecast by 0.75 percentage points to 1.75%. The economy is seen expanding by 2.75% in Dec 2019 and Dec 2020.
- Further, the trimmed mean inflation is seen rising by 1.5% in June 2019 and 1.75% in Dec 2019. The inflation is seen ticking higher to 2% in Dec 2020 and June 2021.
- Aussie seemed to largely ignore dovish RBA forecasts and edged higher to 0.7018.
- However, price action is slipping lower as we write. The major trades at 0.6992 at 04:45 GMT.
- Series of stiff resistance seen on intraday charts. Technical bias remains bearish. Scope for test of 61.8% Fib at 0.6955 and the 0.69.
- 21-EMA is strong resistance at 0.7043. Bearish invalidation only above 200-DMA.
Support levels - 0.6954 (61.8% Fib), 0.69 (psychlogical level)
Resistance levels - 0.70, 0.7043 (21-EMA), 0.7082 (50-DMA)
For details on FxWirePro's Currency Strength Index, visit http://www.fxwirepro.com/currencyindex.


