


 AUDJPY Volatile After Massive Sell-Off: Sell Rallies at 113, Targeting 110 as Bearish Momentum Surges
  FxWirePro: USD/JPY dips as market assess risk of additional FX intervention.
  FxWirePro: GBP/AUD bears maintain upper hand
  FxWirePro- Major Crypto levels and bias summary
  FxWirePro- Major Pair levels and bias summary
  JPY Currency Meter Signals: NZDJPY Bullish (+25) vs CHFJPY (-100) – These Pairs Could Move Next
  Major European Indices Score Extremely Bullish: DAX Eyes 26000, CAC Targets 8600, FTSE100 at 11000 – Key Levels to Watch
  AUDJPY Bears Tighten Grip: Sell Rallies at 110.65-67 Targeting 107.75 as All EMAs Stay Red
  US Magnificent 7 Stocks Trend Score: Amazon & Microsoft Hit Extreme Bullish (+100) as Meta Drops to -100 — Key Resistance & Support Watchlist
  FxWirePro: USD/CNY downtrend loses steam, remains on bearish path
  FxWirePro- Woodies pivot (Major)
  FxWirePro: NZD/USD consolidates overnight gains, but loses momentum
  FxWirePro: GBP/NZD remains weak, eyes 38.2%fib support
  FxWirePro: USD/CAD retreats after Canada posts stronger-than-expected GDP growth
  NZDJPY Retreats on Yen Strength – Bearish Setup Targets 90 After Hitting 92.75 Low
  FxWirePro: USD/ZAR gains as stronger dollar outweighs upbeat South Africa's trade surplus


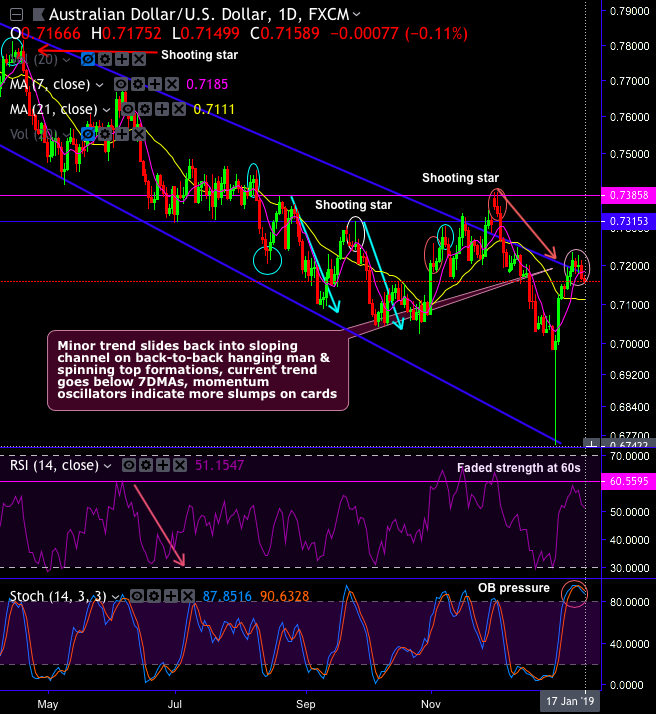
The summary of the write-up in one statement: In a nutshell, the double top pattern of this pair looks more superior than hammer formation, bears slide back in the sloping channel on hanging and spinning top – Trade one touch put and maintain short hedges.
Well, those can hold their nervous, the following descriptive technical analytical piece is worth understanding.
Technical Chart And Candlestick Patterns: Although AUDUSD interim bulls attempted of-late to bounce back, the failure swings are observed at 0.7235 levels.
The hanging man followed by spinning top candles has occurred at 0.7196 and 0.7201 levels respectively.
In addition to these bearish patterns, frequent occurrences of shooting stars at 0.7337, 0.7256, 0.7197 & 0.7254 levels on daily plotting and at 0.9454, 0.7828 & 0.7879 levels on monthly terms, have been signaling weakness of this pair.
As a result, the current trend still appears to be edgy on the above-stated bearish formations at stiff resistance zone amid momentary bullish attempts of bouncing back.
We now continue to view with the same bearish stance as the stiff resistance is observed at 0.7235 - 0.7385 levels and steep slumps have been observed in the recent past at the same juncture.
AUDUSD on a broader perspective: you might have seen hammer formation at 07005 levels on daily terms and most likely hammer pattern on monthly terms, however, needless to be surprised, even if you get to see some mild rallies as both leading indicators (RSI and stochastic curves) show downward convergence on a broader picture.
On the other hand, resumption of downtrend would also not be surprised on overbought momentum in the short run.
The major trend has been extending double top formation with the breach below the neckline and heads towards 1 and a half year lows (refer monthly plotting), we reiterate bearish engulfing candle followed by shooting star patterns plummet prices well below 7EMA again on this timeframe.
While we have still bearish confirmation from the trend indicators, bearish EMA and MACD crossovers with rising volumes with dipping prices, this indicates downtrend to prolong quite further.
Trade tips: On trading perspective, at spot reference: 0.7158 levels, contemplating above technical rationale, it is advisable to execute one touch put option strategy with lower strikes at 0.7122 levels, thereby, we bet on 25 pips on southwards as the strategy is likely to fetch leveraged yields as long as underlying spot FX keeps dipping up to the lower strikes on the expiration.
Alternatively, on hedging grounds, we continue to advocate shorting futures contracts of mid-month tenors as the underlying spot FX likely to target southwards below 0.70 levels in the medium run. Writers in a futures contract are expected to maintain margins in order to open and maintain a short futures position.
Currency Strength Index: FxWirePro's hourly AUD spot index is inching towards -33 levels (which is bearish), while hourly USD spot index was at 5 (neutral) at press time (06:38 GMT).
For more details on the index, please refer below weblink: http://www.fxwirepro.com/currencyindex


