


 FxWirePro: USD/ZAR uptrend loses steam, remains on bullish path
  FxWirePro- Woodies pivot (Major)
  FxWirePro: NZD/USD neutral in the near-term, scope for downward resumption
  FxWirePro: EUR/AUD outlook weaker on renewed downside pressure
  FxWirePro: GBP/USD edges higher as traders await BoE guidance and UK fiscal clarity
  FxWirePro : USD/JPY holds relatively bid on 163 ahead Of FOMC,BoJ meetings
  AUDJPY Weakness Deepens: Sell Rallies Toward 112 as Aussie Dollar Falters
  FxWirePro- Major Crypto levels and bias summary
  FxWirePro: GBP/NZD maintains bersish bias with focus on 2.2900 level
  FxWirePro- Major Pair levels and bias summary
  NZDJPY Pullback: Sell Rallies Toward 93.30 as Yen Weakness Eases
  Major Pairs Action Bias: USDCAD and USDCHF Stand Out as Extremely Bullish While GBPUSD and NZDUSD Turn Extremely Bearish
  EUR/JPY Holds Bullish Bias as Euro Extends Recovery
  JPY Action Bias: USDJPY Emerges as the Clear Bullish Pair to Watch Amid Mixed Crosses
  Crypto Action Bias: ETHUSD Stands Out as the Bullish Pair to Watch
  FxWirePro: USD/CAD runs out of steam but maintains bullish outlook


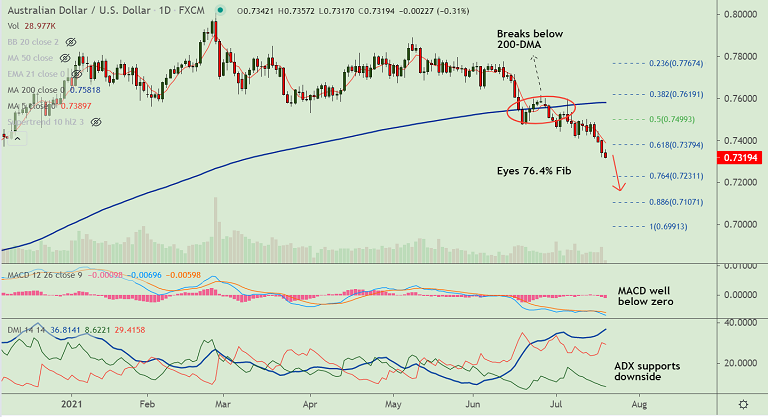
AUD/USD chart - Trading View
Technical Analysis: Bias Bearish
GMMA Indicator
- Daily Chart: Major and minor trend are strongly bearish
- Weekly Chart: Major trend is neutral, minor trend is bearish
Ichimoku Analysis
- Price action is well below the daily cloud and Chinkou span is biased lower
- The pair has dipped into the weeky cloud, further weakness likely
Oscillators
- Momentum is strongly bearish, Stochs and RSI are biased lower
- Stochs are at oversold levels which warrants some caution for pullbacks
Bollinger Bands
- Bollinger bands are spread far apart and are widening
- Volatility is high and rising and will drive the current bearish momentum further
Major Support and Resistance Levels:
Support Levels: 0.7305 (110-week EMA), 0.7231 (converged 76.4% Fib and 200-week MA), 0.72 (Psychological mark)
Resistance Levels: 0.7390 (5-DMA), 0.74 (Psychological mark), 0.7438 (200H MA)
Summary: AUD/USD is extending downside for the 4th consecutive session, trades 0.26% lower at 04:30 GMT. The Reserve Bank of Australia (RBA) Minutes revived dovish expectations, keeping the Aussie depressed.
Ongoing deterioration in risk appetite amid heightened fears that the accelerated spread of the Delta variant will derail the global economic recovery keep investors wary. Investor dump risky assets like the Aussie and chase safe haven plays.
Guidance: Technical bias for the major is also strongly bearish. Scope for test of 0.7230 level.


