


 FxWirePro: USD/CAD positions for another climb, eyes 1.4150 level
  FxWirePro: NZD/USD edges lower, remains on back foot
  FxWirePro: GBP/AUD downside pressure builds, key support level in focus
  Major Pair Action Bias: Bullish Pairs to Watch Out For
  FxWirePro : USD/JPY holds relatively bid on 163 ahead Of FOMC,BoJ meetings
  FxWirePro: USD/CAD gaining momentum for a move towards 1.4200 level
  FxWirePro- Woodies pivot (Major)
  FxWirePro: EUR/NZD up trend gains momentum but hurdles ahead
  GBPJPY Slips After Sterling Weakness, Bears Eye 216
  NZDJPY Pullback: Sell Rallies Toward 93.30 as Yen Weakness Eases
  FxWirePro: EUR/AUD outlook weaker on renewed downside pressure
  FxWirePro- Major Crypto levels and bias summary
  FxWirePro: AUD/USD dips after RBA Governor speech
  JPY Action Bias: Bullish Pairs to Watch Out For
  FxWirePro: GBP/NZD downside pressure builds, key support levels in focus
  Major Pairs Action Bias: USDCAD and USDCHF Stand Out as Extremely Bullish While GBPUSD and NZDUSD Turn Extremely Bearish
  FxWirePro: GBP/AUD under pressure as pound continues to weaken


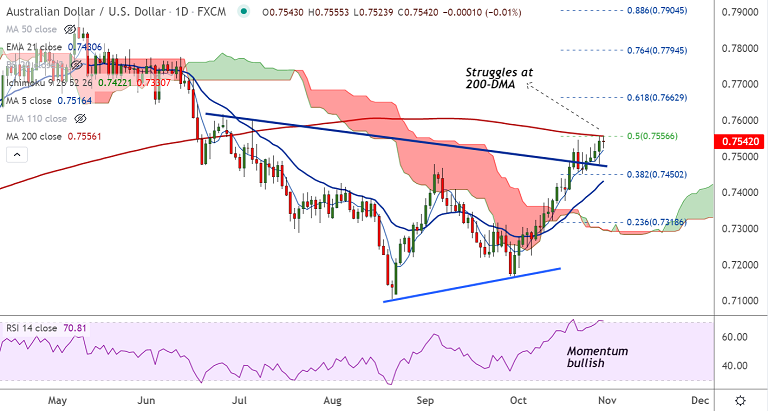
AUD/USD chart - Trading View
Spot Analysis:
AUD/USD was trading largely unchanged at 0.7545 at around 08:20 GMT.
Previous Week's High/ Low: 0.7546/ 0.7378
Previous Session's High/ Low: 0.7555/ 0.7479
Fundamental Overview:
Australian dollar stays on the back foot despite strong Retail Sales data. Sour sentiment exerts additional downside pressure.
Data released earlier today showed Australia Retail Sales snapped a three-month downtrend and rose past +0.2% forecast to +1.3%, versus -1.7% prior, during September.
Additionally, the Producer Price Index (PPI) data for the third quarter (Q3) also beat +0.3% market consensus and +0.7% prior readings to +1.1%.
Further, the YoY figures rose to 2.9% versus 3.2% expected and 2.2% previous readouts.
US gross domestic product grew at only a 2% annualized rate in the quarter ended in September, missing forecasts at a 2.7% rate.
Further, consumers' inflation expectations over the next 12 months jumped to a 13-year high.
The dollar index (DXY) was headed for a third straight weekly decline, consolidates previous session's 0.53% slump .
Market participants now await the Fed policy meeting next week. Investors focus on how the Federal Reserve responds to higher inflation and concerns over tepid economic growth.
Technical Analysis:
- AUD/USD struggles at major resistance at 200-DMA at 0.7556
- Momentum is bullish, MACD and ADX support upside
- GMMA shows major trend is shifting bullish, while minor trend is strongly bullish
- Volatility is high as evidenced by widening Bollinger bands
Major Support and Resistance Levels:
Support - 0.7516 (5-DMA), Resistance - 0.7556 (200-DMA)
Summary: AUD/USD trades with a bullish technical bias. Watch out for decisive break above 200-DMA for upside continuation.


