


 JPY Action Bias: Bullish Pairs to Watch Out For
  Major Pair Action Bias: Bullish Pairs to Watch Out For
  JPY Action Bias: USDJPY Emerges as the Clear Bullish Pair to Watch Amid Mixed Crosses
  AUDJPY Action Bias: Bullish Dip-Buy Setup Despite Flat Neutral Bias
  FxWirePro: USD/CNY dips as yuan firms on improving risk appetite
  FxWirePro: USD/CAD gaining momentum for a move towards 1.4200 level
  FxWirePro: EUR/NZD up trend gains momentum but hurdles ahead
  FxWirePro- Woodies pivot (Major)
  FxWirePro- Major Pair levels and bias summary
  FxWirePro: AUD/USD dips after RBA Governor speech
  FxWirePro : USD/JPY holds relatively bid on 163 ahead Of FOMC,BoJ meetings
  GBPJPY Slips After Sterling Weakness, Bears Eye 216
  FxWirePro: EUR/NZD downside pressure builds, key support level in focus
  FxWirePro: USD/CAD positions for another climb, eyes 1.4150 level
  FxWirePro: GBP/NZD gains some ground but bias is still bearish
  FxWirePro: EUR/AUD outlook weaker on renewed downside pressure
  FxWirePro: GBP/AUD under pressure as pound continues to weaken


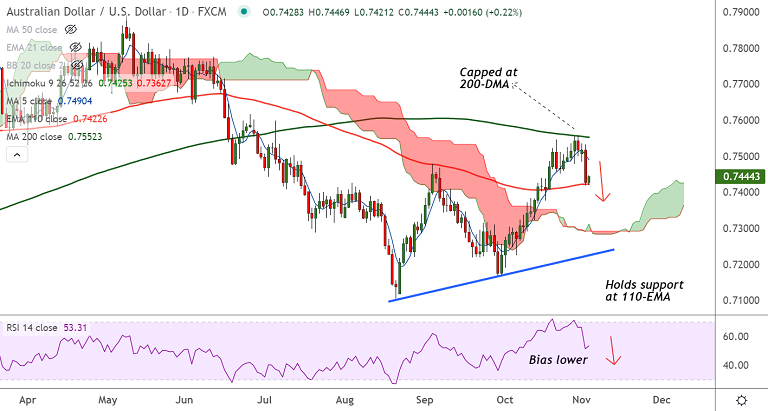
AUD/USD chart - Trading View
Spot 07:05 GMT: 0.7441
Session's High/ Low: 0.7446/ 0.7421
Previous Week's High/ Low: 0.7555/ 0.7461
Previous Session's High/ Low: 0.7532/ 0.7420
Technical Analysis:
- Upside was rejected at 200-DMA, price action is holding support at 110-EMA
- GMMA indicator shows near term moving averages have turned bearish
- 5-DMA has turned and MACD confirms bearish crossover on signal line
- Stochs show bearish rollover from overbought levels, RSI is biased lower
Fundamental Overview:
The Reserve Bank of Australia (RBA) abandoned its short-term yield target and dropped its expectation of holding rates at record lows until 2024.
The Aussie depressed further because the bank also pushed back on aggressive pricing for 2022 hikes.
Major Support Levels:
S1: 0.7422 (110-EMA)
S2: 0.7393 (55-EMA)
Major Resistance Levels:
R1: 0.7490 (5-DMA)
R2: 0.7552 (200-DMA)
Summary: AUD/USD pivotal at 110-EMA support. Technical bias is tilted bearish. Break below 110-EMA will see weakness. Dip till 0.7393 likely.


