


 Buy the Dips on EUR/JPY: Bullish Structure Points to 188 Target Ahead of Fed
  FxWirePro: GBP/AUD drifts lower after BOE rate decision
  FxWirePro: USD/JPY edges higher as focus shifts to BOJ decision
  FxWirePro:EUR/NZD gains some upside momentum but still bearish
  FxWirePro: GBP/USD rises as soft US data pressures dollar
  JPY Currency Meter Signals: NZDJPY Bullish (+25) vs CHFJPY (-100) – These Pairs Could Move Next
  FxWirePro: USD/ CNY hits one-month low,scope for futher downside
  Major FX Action Bias & US Market Sentiment: NZD/USD (Extremely Bullish) & AUD/USD (Bullish) Watchlist
  FxWirePro- Major Pair levels and bias summary
  FxWirePro: AUD/USD gains some ground but outlook is bearish
  JPY Action Bias: EURJPY and CADJPY Emerge as Extremely Bullish Pairs to Watch
  FxWirePro: NZD/USD firms as Kiwi gains on strong ANZ business outlook data
  EURUSD Spikes to 1.14306 on Fed Pause as Traders Eye Sell-the-Rally Setup
  FxWirePro: USD/CAD slips after Fed holds rates steady
  FxWirePro:USD/JPY climbs back above 160.00 after BOJ rate decision


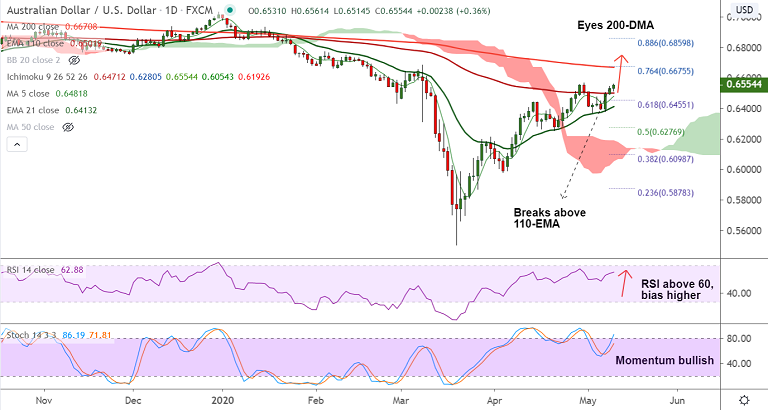
AUD/USD chart - Trading View
AUD/USD was trading 0.34% higher on the day at 0.6553 at around 03:50 GMT, risk reset buoys the antipodeans.
In its first-quarter monetary policy report published on Sunday, the People’s Bank of China (PBOC) said it lowered interest rates on its standing lending facility (SLF) in April.
United States inflation data due on Tuesday and Australian unemployment figures due on Thursday will be major catalysts for price action.
Technical indicators are bullishly aligned. GMMA indicator shows minor trend is strongly bullish, while major trend is turning bullish.
Momentum studies are bullish. Volatility is rising as evidenced by widening Bollinger bands.
Price action has broken above 110-EMA and is on track to test 200-DMA at 0.6670.
200-DMA breakout will open upside. On the flipside, retrace below 55-EMA negates bullish bias.
Major Support Levels:
- S1: 0.6501 (110-EMA)
- S2: 0.6481 (5-DMA)
- S3: 0.6398 (55-EMA)
Major Resistance Levels:
- R1: 0.6670 (200-DMA)
- R2: 0.6715 (Channel top)
- R3: 0.6860 (88.6% Fib)
Summary: Technical studies show the pair is poised for further gains. Scope for test of 200-DMA.
Guidance: Good to go long on dips around 0.6530, SL: 0.6470, TP: 0.66/ 0.6660


