


 FxWirePro: GBP/NZD gains some ground but bias is still bearish
  FxWirePro- Major Crypto levels and bias summary
  FxWirePro: AUD/USD gains on Iran-US truce hopes, risk rally
  Major Pair Action Bias: Bullish Pairs to Watch Out For
  FxWirePro: EUR/AUD outlook weaker on renewed downside pressure
  FxWirePro: GBP/NZD downside pressure builds, key support levels in focus
  FxWirePro: USD/CAD positions for another climb, eyes 1.4150 level
  FxWirePro- Major Pair levels and bias summary
  GBPJPY Slips After Sterling Weakness, Bears Eye 216
  NZDJPY Action Bias: Bullish Dip-Buying Opportunity on Broad Yen Weakness
  Major Pairs Action Bias: USDCAD and USDCHF Stand Out as Extremely Bullish While GBPUSD and NZDUSD Turn Extremely Bearish
  FxWirePro: GBP/AUD downside pressure builds, key support level in focus
  FxWirePro: NZD/USD gains as U.S.-Iran peace hopes boost risk sentiment
  FxWirePro: USD/CAD gaining momentum for a move towards 1.4200 level
  NZDJPY Pullback: Sell Rallies Toward 93.30 as Yen Weakness Eases
  FxWirePro: AUD/USD dips after RBA Governor speech
  FxWirePro: GBP/AUD under pressure as pound continues to weaken


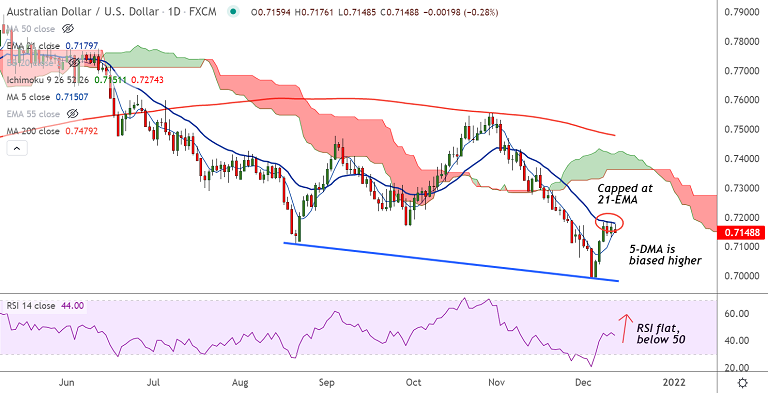
Chart - Courtesy Trading View
Technical Analysis: Bias Bullish
GMMA Indicator
- Bearish on the daily charts
- Bullish on the hourly charts
Ichimoku Analysis
- Price action is well below daily and weekly cloud
Oscillators
- Oscillators are biased lower on the weekly charts
- Stochs and RSI show bullish momentum on the daily charts
Bollinger Bands
- Bollinger bands are wide, show high volatility
Major Support Levels: 0.7151 (5-DMA), 0.7111 (200H MA)
Major Resistance Levels: 0.7180 (converged 200-week MA and 21-EMA), 0.7265 (55-EMA)
Summary: AUD/USD is grinding sideways below 21-EMA resistance for the past 4 sessions. Technical bias is tilted bullish, decisive break above 200-week MA will fuel further gains.


