


 GBPJPY Slips After Sterling Weakness, Bears Eye 216
  Major Pairs Action Bias: USDCAD and USDCHF Stand Out as Extremely Bullish While GBPUSD and NZDUSD Turn Extremely Bearish
  FxWirePro: EUR/NZD up trend gains momentum but hurdles ahead
  NZDJPY Action Bias: Bullish Dip-Buying Opportunity on Broad Yen Weakness
  FxWirePro: USD/ZAR retreats but trend is still bullish
  JPY Action Bias: USDJPY Emerges as the Clear Bullish Pair to Watch Amid Mixed Crosses
  FxWirePro: GBP/USD edges higher as traders await BoE guidance and UK fiscal clarity
  FxWirePro- Woodies pivot (Major)
  FxWirePro: USD/CAD gaining momentum for a move towards 1.4200 level
  FxWirePro: USD/CAD runs out of steam but maintains bullish outlook
  FxWirePro: GBP/AUD downside pressure builds, key support level in focus
  EUR/JPY Holds Bullish Bias as Euro Extends Recovery
  FxWirePro: EUR/AUD outlook weaker on renewed downside pressure
  EUR/USD Bounces from Monthly Low, But Bearish Pressure Remains
  FxWirePro- Major Pair levels and bias summary


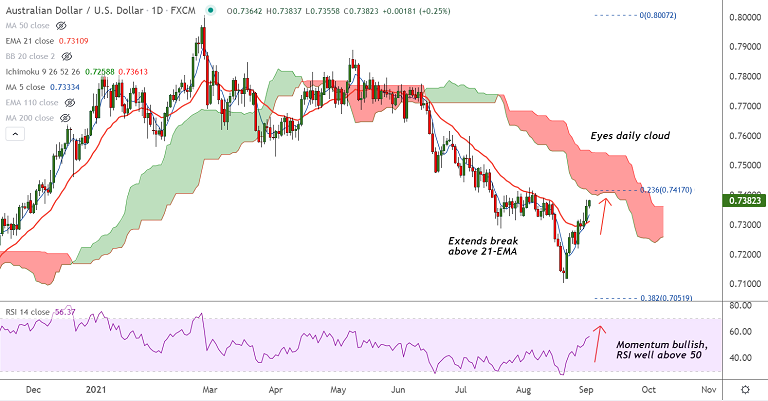
AUD/USD chart - Trading View
Spot Analysis:
AUD/USD was trading 0.11% higher on the day at 0.7372 at around 05:45 GMT
Previous Week's High/ Low: 0.7316/ 0.7118
Previous Session's High/ Low: 0.7383/ 0.7308
Fundamental Overview:
Aussie Trade Balance rose past market consensus, but souring risk appetite amid virus woes keeps upside limited.
China’s run of disappointing data also doesn't bode well for the antipodeans.
Australia trade balance prints at 12117M, crosses 10200M market consensus and 10496M previous readout.
Details of the report showed Imports and Exports also improved from 1.0% and 4.0% respective priors to 3.3% and 4.8%.
Furthermore, Investment Lending for Home crossed 0.7% level of June with 1.8% figures for July.
DXY trades weak after poor ADP data on Wednesday, adding upside support to the pair.
Technical Analysis:
- AUD/USD extends break above 21-EMA, inches closer towards daily cloud
- Momentum studies are bullish, Stochs and RSI are sharply higher
- MACD supports gains, Chikou span is biased higher, bullish 5-DMA crossover on 20-DMA adds to the upside bias
- GMMA shows near-term trend on the daily charts has turned bullish
Major Support and Resistance Levels:
Support - 0.7332 (5-DMA), Resistance - 0.7394 (55-EMA)
Summary: AUD/USD bullish momentum to drive further gains. Caution ahead of the crucial US NFP data is likely to keep upside limited.
Immediate resistance is seen at 55-EMA at 0.7394. Break above finds major resistance at daily cloud at 0.7409.


