
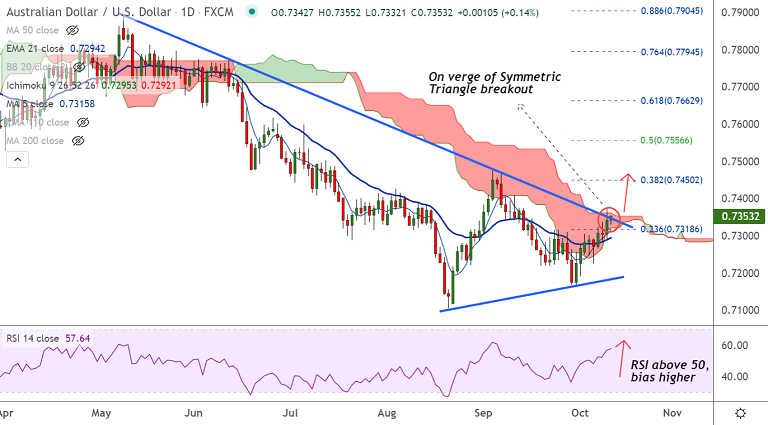
AUD/USD chart - Trading View
AUD/USD was trading 0.20% higher on the day at 0.7357 at around 05:40 GMT, outlook is bullish.
The Australian dollar has been gaining on surging energy prices. On Monday, U.S. crude touched $82.18 a barrel, its highest since late 2014, and Brent crude hit a three year high.
However, iron ore futures were under pressure on Tuesday, with Dalian contracts erasing early gains, as investor focus shifted back to steel production curbs in China.
The inflationary impact of rising energy prices has solidified the case for the U.S. Federal Reserve to announce a tapering of its massive bond buying programme in November.
Falling iron-ore prices and strength in the U.S dollar could hamper gains. DXY, the dollar index tested 94.4, shy of one-year high of 94.504 touched at the end of September.
Technical indicators for the pair are biased higher and suggest that the pair is poised for further gains.
Price action is on verge of 'Symmetric Triangle' and daily Ichimoku cloud breakout. Momentum is bullish and volatility is high.
Next major hurdle for bulls lies at 0.7406 (110-EMA). Break above raises scope for test of 38.2% Fib retracement at 0.7450.


