


 FxWirePro: GBP/USD range-bound as Iran uncertainty keeps traders cautious
  Ethereum Cracks Under $1,700: Sell the Rally Near $1,750 as Bears Eye $1,380–$1,200
  Energy Sector Outlook 2025: AI's Role and Market Dynamics
  Relief Rally Extends to 112.75, but AUDJPY EMA Structure Favors Selling
  UBS Predicts Potential Fed Rate Cut Amid Strong US Economic Data
  FxWirePro: EUR/ NZD uptrend loses steam, remains on bullish path
  Goldman Predicts 50% Odds of 10% U.S. Tariff on Copper by Q1 Close
  FxWirePro- Major Pair levels and bias summary
  FxWirePro: AUD/ USD strongly bearish despite upside attempts
  China's Refining Industry Faces Major Shakeup Amid Challenges
  FxWirePro- Woodies pivot (Major)
  European Stocks Rally on Chinese Growth and Mining Merger Speculation
  FxWirePro: USD/ CNY falls towards 6.750, bears keep the advantage
  Lithium Market Poised for Recovery Amid Supply Cuts and Rising Demand
  S&P 500 Relies on Tech for Growth in Q4 2024, Says Barclays


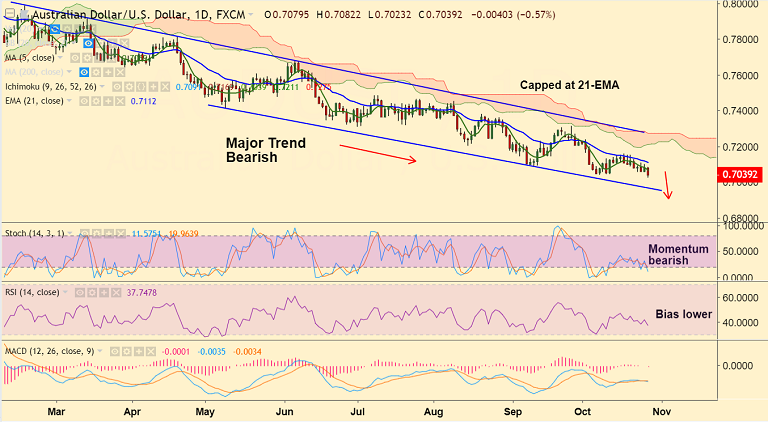
AUD/USD chart on Trading View used for analysis
- AUD/USD trades 0.69% lower on the day at 0.7032 at the time of trading.
- The pair has hit new multi-month lows, levels unseen since Feb 2016.
- Major trend remains bearish. Price action grinds lower in sloping channel pattern.
- Technical studies support further weakness. We see no signs of reversal in the pair.
- Next major support lies at 0.6975 (channel base), breach there will accentuate weakness.
- On the flip side, 21-EMA at 0.7112 is strong resistance. Break above to see further gains.
Support levels - 0.70, 0.6975 (channel base)
Resistance levels - 0.7067 (5-DMA), 0.7112 (21-EMA)
Recommendation: Good to stay short on upticks, SL: 0.7112, TP: 0.70/ 0.6975
For details on FxWirePro's Currency Strength Index, visit http://www.fxwirepro.com/currencyindex.


