


 US Magnificent 7 Stocks Trend Score: Amazon & Microsoft Hit Extreme Bullish (+100) as Meta Drops to -100 — Key Resistance & Support Watchlist
  FxWirePro: USD/CAD retreats after Canada posts stronger-than-expected GDP growth
  FxWirePro- Major Pair levels and bias summary
  FxWirePro- Major Pair levels and bias summary
  AUD/JPY Slips Below 112 as BOJ Intervention Sparks Bearish Momentum: Sell the Rallies
  JPY Currency Meter Signals: NZDJPY Bullish (+25) vs CHFJPY (-100) – These Pairs Could Move Next
  FxWirePro: AUD/USD gains some ground but outlook is bearish
  FxWirePro: GBP/AUD drifts lower after BOE rate decision
  FxWirePro: USD/CNY dips to hit three year low,scope for further downside
  FxWirePro: USD/ZAR gains as stronger dollar outweighs upbeat South Africa's trade surplus
  FxWirePro- Major Crypto levels and bias summary
  US Magnificent 7 Stocks Trend Score: Amazon & Microsoft Hit Extreme Bullish (+100) as Meta Drops to -100 — Key Resistance & Support Watchlist
  Major FX Action Bias & US Market Sentiment: NZD/USD (Extremely Bullish) & AUD/USD (Bullish) Watchlist
  FxWirePro: GBP/NZD remains weak, eyes 38.2%fib support
  FxWirePro: GBP/USD rises as soft US data pressures dollar
  FxWirePro:USD/JPY climbs back above 160.00 after BOJ rate decision


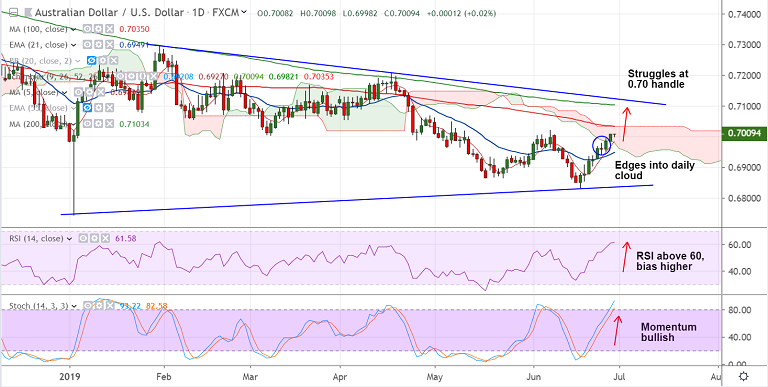
AUD/USD chart - Trading View
AUD/USD struggles to extend gains beyond the 0.70 handle. Technical bias remains bullish.
Data released earlier today showed Australia's private sector credit rose 3.6% y/y in May, compared to 3.7% in the preceding month.
On a month-on-month basis, the metric rose 0.2%, missing the estimated growth of 0.3%.
Looming uncertainty over a US-China trade deal and uninspiring Australian data fail to provide support.
Price action has broken into daily cloud and technical indicators support further gains.
Stochs and RSI are sharply higher and MACD shows bullish crossover on signal line.
Next bull target lies at 110-EMA at 0.7033. Further upside could see test of 200-DMA at 0.7103.
Focus on Trump-Xi trade meeting at G20 summit and U.S. PCE data for further impetus.
Support levels - 0.6984 (5-DMA), 0.6949 (21-EMA), 0.69
Resistance levels - 0.7035 (converged cloud top and 100-DMA), 0.71 (200-DMA), 0.7125 (Trendline)
For details on FxWirePro's Currency Strength Index, visit http://www.fxwirepro.com/currencyindex.


