


 FxWirePro: AUD/USD dips after RBA Governor speech
  FxWirePro: NZD/USD edges lower, remains on back foot
  FxWirePro : USD/JPY holds relatively bid on 163 ahead Of FOMC,BoJ meetings
  FxWirePro: EUR/NZD downside pressure builds, key support level in focus
  FxWirePro: AUD/USD gains on Iran-US truce hopes, risk rally
  FxWirePro: GBP/AUD under pressure as pound continues to weaken
  FxWirePro: GBP/AUD downside pressure builds, key support level in focus
  FxWirePro: USD/CAD positions for another climb, eyes 1.4150 level
  FxWirePro- Major Pair levels and bias summary
  FxWirePro: GBP/NZD downside pressure builds, key support levels in focus
  FxWirePro- Major Crypto levels and bias summary
  FxWirePro- Major Pair levels and bias summary
  FxWirePro: USD/ZAR uptrend loses steam, remains on bullish path
  GBPJPY Slips After Sterling Weakness, Bears Eye 216
  JPY Action Bias: Bullish Pairs to Watch Out For
  FxWirePro: NZD/USD gains as U.S.-Iran peace hopes boost risk sentiment


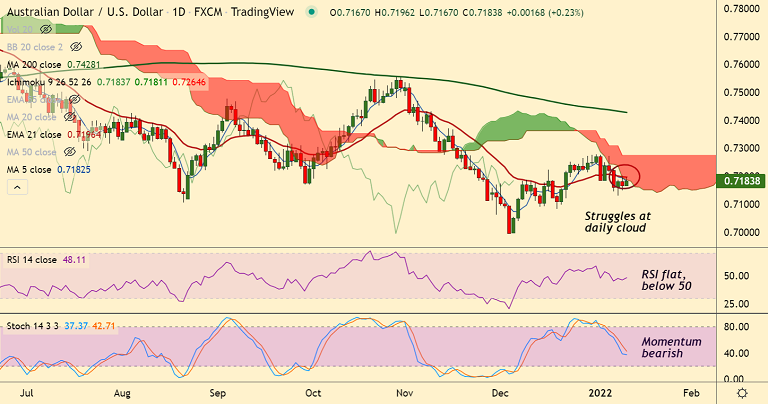
Chart - Courtesy Trading View
Technical Analysis:
GMMA Indicator
- Major and minor trend are bearish
Ichimoku Analysis
- Price action is capped at daily cloud
- Chikou span is biased higher
Oscillators
- RSI is flat, below the 50 mark
- Stochs are biased lower
Bollinger Bands
- Bollinger bands show constriction
- Volatility is shrinking
Major Support Levels: 0.7170 (200-week MA), 0.7113 (Lower BB)
Major Resistance Levels: 0.7197 (21-EMA), 0.7213 (200H MA)
Summary: AUD/USD struggles for direction at 21-EMA and daily cloud resistance. Technical indicators show a bearish tilt. Break out above 21-EMA could change near-term bias. Focus on US inflation data and Fed speech for impetus.


