
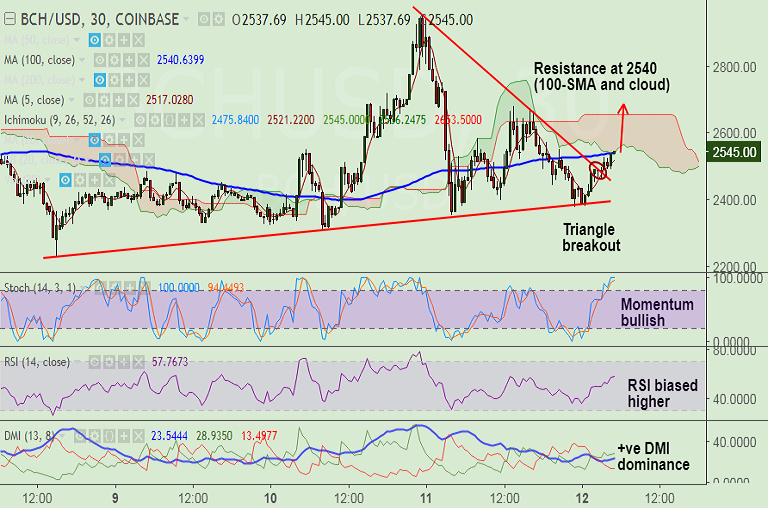
- BCH/USD has shown a decisive breakout of 'Symmetric Triangle' pattern on 30 minute charts.
- Technical studies are also bullish, which support further upside in the pair.
- RSI strong above 50 levels and biased higher. Stochs show bullish momentum.
- We also see +ve DMI dominance with ADX support.
- The pair faces immediate resistance at 2540 which is nearly converged 100-SMA and cloud on 30 min chart.
- Decisive break there could see test of 61.8% Fib at 2734 ahead of 2832 (78.6% Fib).
- Bullish invalidation likely if the pair retraces into 'Triangle'.
Support levels - 2513 (23.6% Fib retrace of 2956 to 2377 fall), 2474 (1H 100-SMA), 2450 (trendline/ triangle top)
Resistance levels - 2540 (1H 50-SMA, 30 Min 100-SMA, 30 Min cloud), 2734 (61.8% Fib), 2832 (78.6% Fib)
Recommendation: Good to go long on breakout at 2540, SL: 2450, TP: 2670/ 2735/ 2830
FxWirePro launches Absolute Return Managed Program. For more details, visit http://www.fxwirepro.com/invest


