


 FxWirePro- Major Crypto levels and bias summary
  NZDJPY Bullish Surge: Strong Kiwi Ignites Fresh Upside as 94 Support Holds and All EMAs Align
  FxWirePro- Major Crypto levels and bias summary
  FxWirePro: EUR/AUD outlook weaker on renewed downside pressure
  JPY Action Bias: Extremely Bullish Surge Ignites Across NZD, GBP & AUD
  FxWirePro:EUR/NZD dips below lower range, bearish bias increases
  Major Pair Action Bias: Extremely Bullish Surge Powers GBPUSD & NZDUSD as Bullish Momentum Ignites


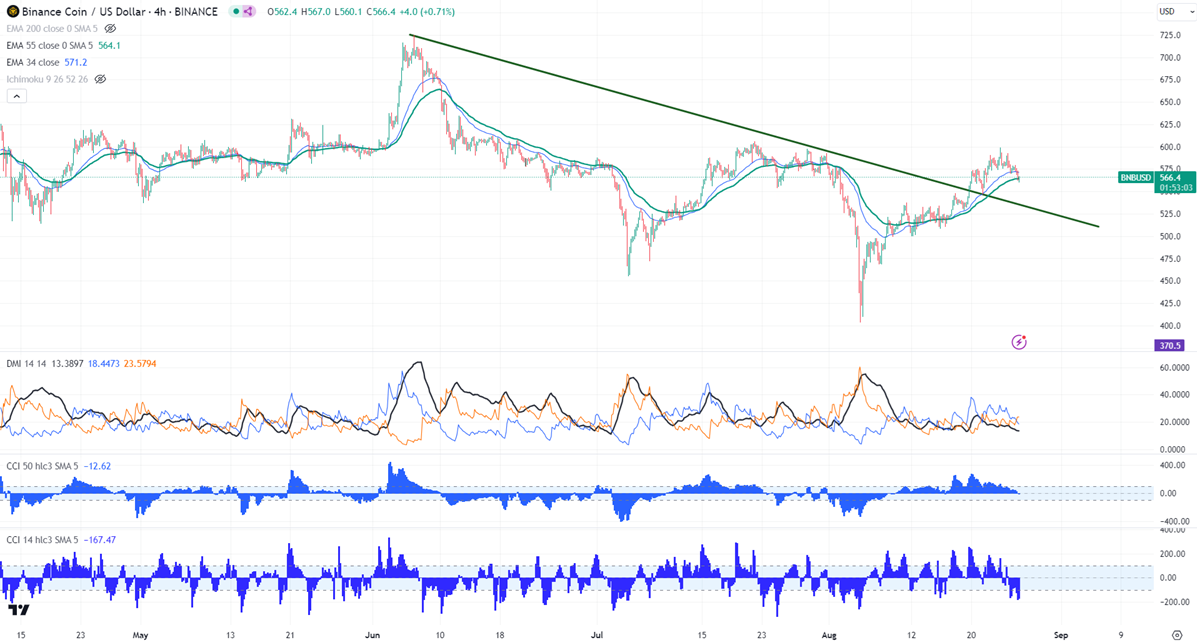
Horizontal trend line- $605
BNBUSD was one of the best performers this month.
Any daily close above $605 confirms further bullishness.
BNBUSD showed a nice recovery of nearly $200 from this month's low of $403.40.The pair holds well above the short-term (21 and 55 EMA) and long-term moving average. It hit a high of $598.8 and is currently trading around $566.10.
The bullish invalidation can happen if the pair closes below $400. On the lower side, the near-term support is $545. Any break below targets $515/$500/$460.
The immediate resistance stands at around $606. Any breach above confirms bullish continuation. A jump to $635/$700 is possible. A surge past $700 will take it to $800/$1000.
Indicators ( 4- hour chart)
Directional movement index - Neutral
CCI (50)- Bearish
CCI(14)- Bearish
It is good to buy on dips around $540 with SL around $500 for TP of $635/$700.


