


 FxWirePro:USD/JPY hovers near 40-year peak,intervention fears linger
  Major Crypto Action Bias: ETHUSD Turns Bullish – Only Bullish Pair to Watch
  FxWirePro- USD/CHF Holds Above 0.8120 as Bulls Target 0.8200
  FxWirePro: AUD/USD bulls struggles as upside momentum fades
  FxWirePro: GBP/USD slips as Middle East tensions boost safe-haven dollar
  FxWirePro: USD/CNY gains some upside momentum but bias still bearish
  FxWirePro- Major Pair levels and bias summary
  Major Pair Action Bias: USDCHF Turns Bullish as EURUSD Stays Bearish – Key Pairs to Watch
  ETHUSD Breaks Above $1900 as Bulls Eye $2300 and Beyond
  FxWirePro: USD/ZAR slips as rand gains on U.S.-Iran developments
  FxWirePro: USD/CAD retreats slightly but trend is still bullish
  AUDJPY Pulls Back on Profit Booking: Buy Dips Toward 117/118
  FxWirePro: USD/CAD retains bid tone,eyes 1.4200 level
  FxWirePro: GBP/NZD downtrend loses steam, remains on bearish path


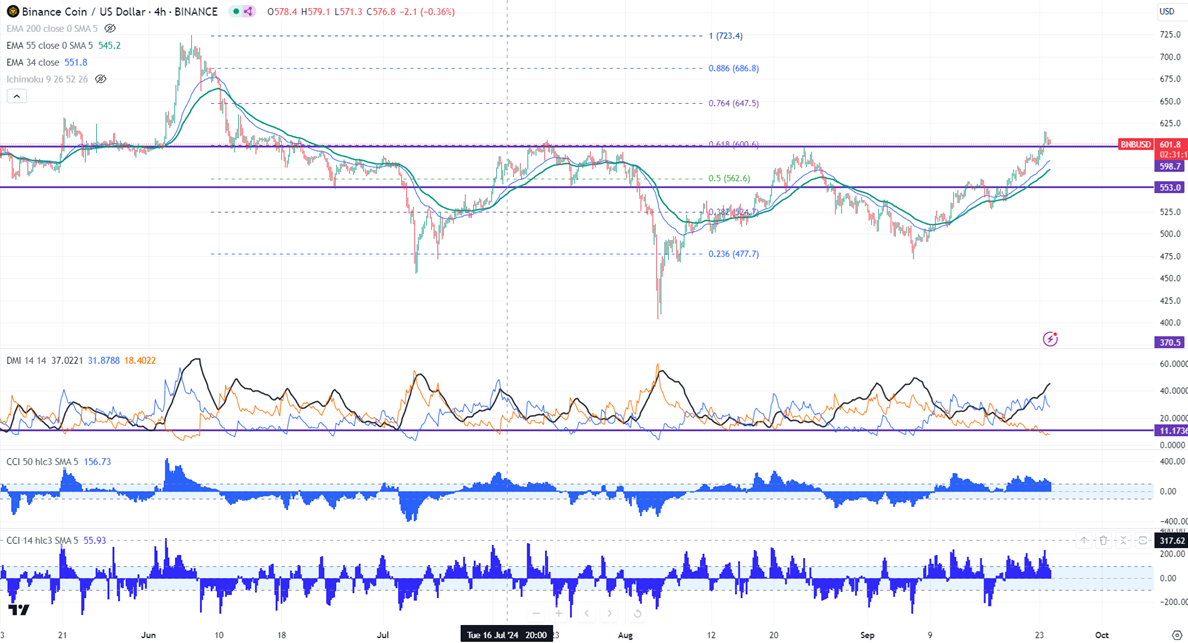
Intraday bias - Bullish
Re-test level- $600
Any close above $605 confirms a bullish continuation.
BNBUSD breaks psychological resistance $600 after a long consolidation. It hits a high of $614.80 and is currently trading around $600.50.
The pair holds above 34 and 55 EMA in the 4-hour chart. The bullish trend continuation can happen if the pair closes above $600 in the daily chart. On the lower side, the near-term support is $590. Any break below targets $575/$560/$540/$525 (200-day EMA) $490/$470/$456 (127.2% fib)/$437 (1.618% fib)/$403 is possible.
The immediate resistance stands at around $615. Any breach above confirms minor bullishness. A jump to $647/$700 is possible. A surge past $725 will take it to $800.
Indicators ( Daily chart)
Directional movement index - Bullish
CCI (50)- Bullish
CCI(14)- Bullish
It is good to buy on dips around $590 with SL around $560 for TP of $700.


