


 FxWirePro: GBP/NZD gains some upside momentum but still bearish
  NZDJPY Bullish Surge: Strong Kiwi Ignites Fresh Upside as 94 Support Holds and All EMAs Align
  FxWirePro- Major Crypto levels and bias summary
  FxWirePro:EUR/NZD dips below lower range, bearish bias increases
  FxWirePro: USD/JPY uptrend loses steam, remains on bullish path
  FxWirePro: GBP/NZD downtrend loses steam, remains on bearish path
  FxWirePro: GBP/USD under pressure despite UK's modest economic growth
  FxWirePro- Major Crypto levels and bias summary
  FxWirePro- Woodies pivot (Major)
  AUDJPY Bullish Surge: Strong Australian Dollar Fuels Fresh Upside as Pair Holds Above 113.50 and All EMAs Align
  FxWirePro: AUD/USD edges lower, but bullish outlook persists
  Major Pair Action Bias: Extremely Bullish Surge Powers GBPUSD & NZDUSD as Bullish Momentum Ignites


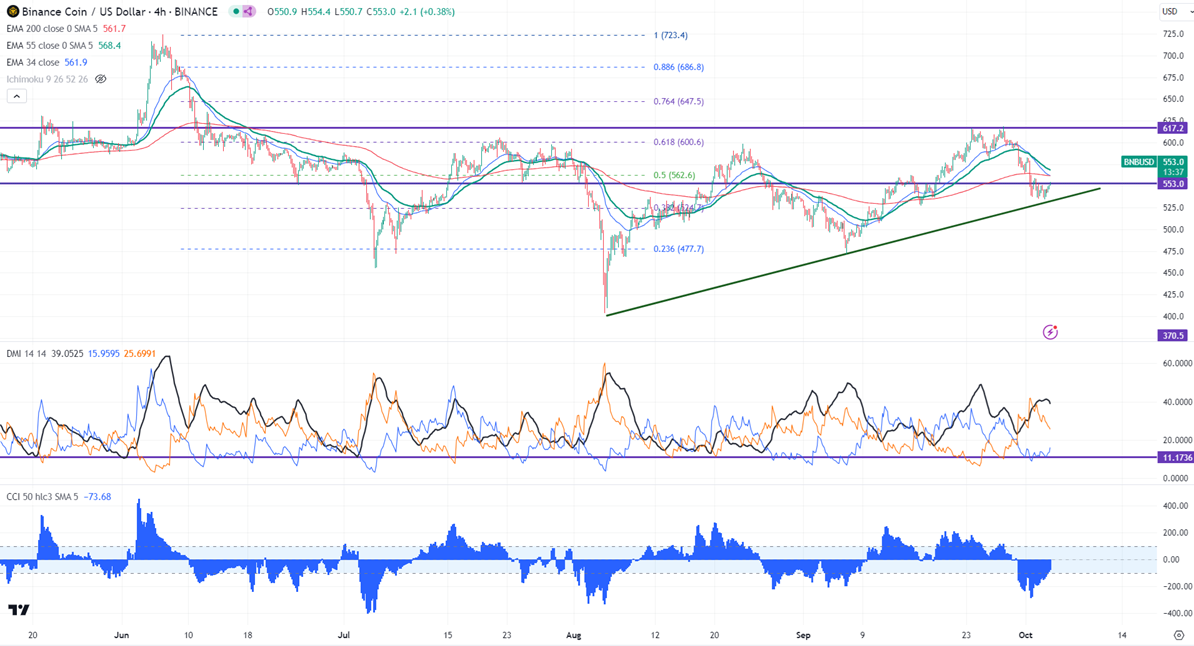
Intraday bias - Bullish
Trend reversal level- $528 (200- day EMA)
Any close above $620 confirms a bullish continuation.
BNBUSD took support near the trend line and showed a minor pullback. It hits a low of $534.70 and is currently trading around $553.
The pair holds below 34 and 55 EMA in the 4-hour chart. The bullish trend continuation can happen if the pair closes above $615 in daily chart. On the lower side, the near-term support is $528. Any break below targets $500/$470 is possible.
The immediate resistance stands at around $553. Any breach above confirms minor bullishness. A jump to $562/$570/$605/$620/$647/$700 is possible. A surge past $725 will take it to $800.
Indicators ( 4- hour chart)
Directional movement index - Bearish
CCI (50)- Bearish
It is good to buy on dips around $535 with SL around $500 for TP of $700.


