


 FxWirePro: EUR/AUD neutral in the near term, scope for downward resumption
  FxWirePro: GBP/USD under pressure despite UK's modest economic growth
  FxWirePro- Major Pair levels and bias summary
  Gold Loses Steam After Strong U.S. Retail Sales
  FxWirePro: USD/CAD falls after BoC rate hold and weak U.S. producer inflation
  FxWirePro- Major Crypto levels and bias summary
  FxWirePro: GBP/NZD downtrend loses steam, remains on bearish path
  ETH Stands Alone Bullish; BTC, SOL, XRP, BNB Neutral
  FxWirePro: GBP/NZD gains some upside momentum but still bearish
  FxWirePro- Major Crypto levels and bias summary
  JPY Action Bias: CADJPY Turns Extremely Bullish While Other Pairs Hold Positive Ground


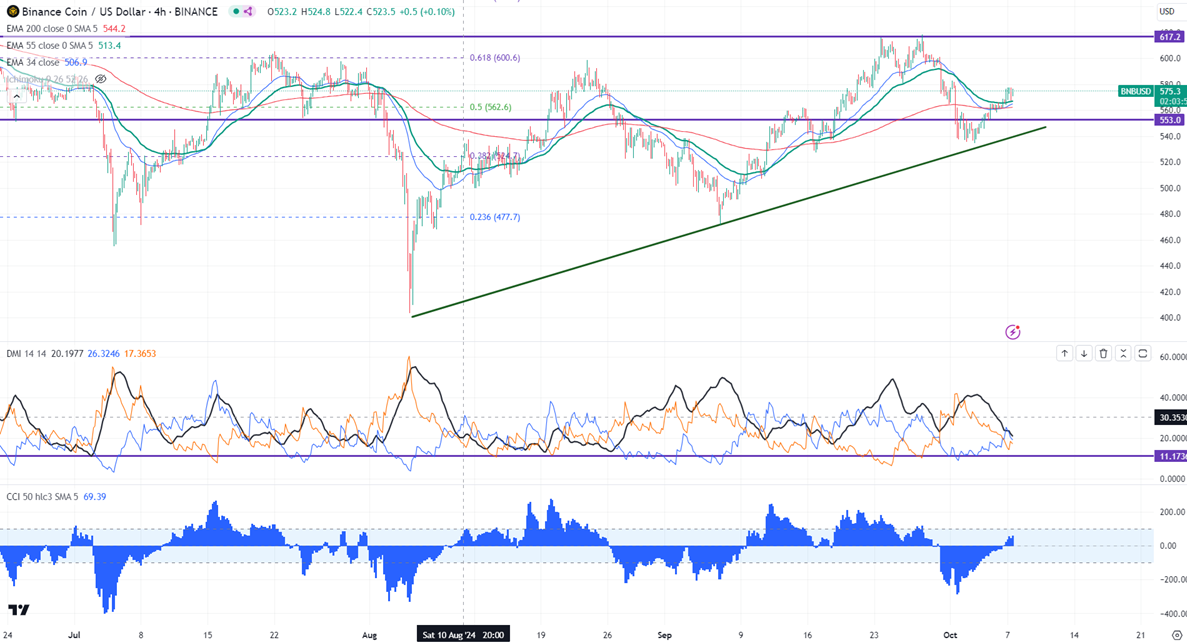
Intraday bias - Bullish
Trend reversal level- $528 (200- day EMA)
Any close above $620 confirms a bullish continuation.
BNBUSD took support near the 200-day EMA and showed a minor pullback. It hits a low of $561.20 yesterday and is currently trading around $553.
The pair holds above 34 and 55 EMA in the 4-hour chart. The bullish trend continuation can happen if the pair closes above $615 in daily chart. On the lower side, the near-term support is $561 (resistance turned into support). Any break below targets $540/$528/$500/$470 is possible.
The immediate resistance stands at around $580. Any breach above confirms minor bullishness. A jump to $605/$620/$647/$700 is possible. A surge past $725 will take it to $800.
Indicators ( 4- hour chart)
Directional movement index - Neutral
CCI (50)- Bearish
It is good to buy on dips around $560 with SL around $528 for TP of $700.


