


 FxWirePro- Major Crypto levels and bias summary
  Major Pair Action Bias: Extremely Bullish Surge Powers GBPUSD & NZDUSD as Bullish Momentum Ignites
  FxWirePro- Major Crypto levels and bias summary
  FxWirePro- Major Crypto levels and bias summary
  AUDJPY Bullish Surge: Strong Australian Dollar Fuels Fresh Upside as Pair Holds Above 113.50 and All EMAs Align
  FxWirePro: GBP/NZD downtrend loses steam, remains on bearish path
  FxWirePro: AUD/ USD eases as risk sentiment remains fragile
  FxWirePro:EUR/NZD dips below lower range, bearish bias increases
  FxWirePro: AUD/USD edges lower, but bullish outlook persists


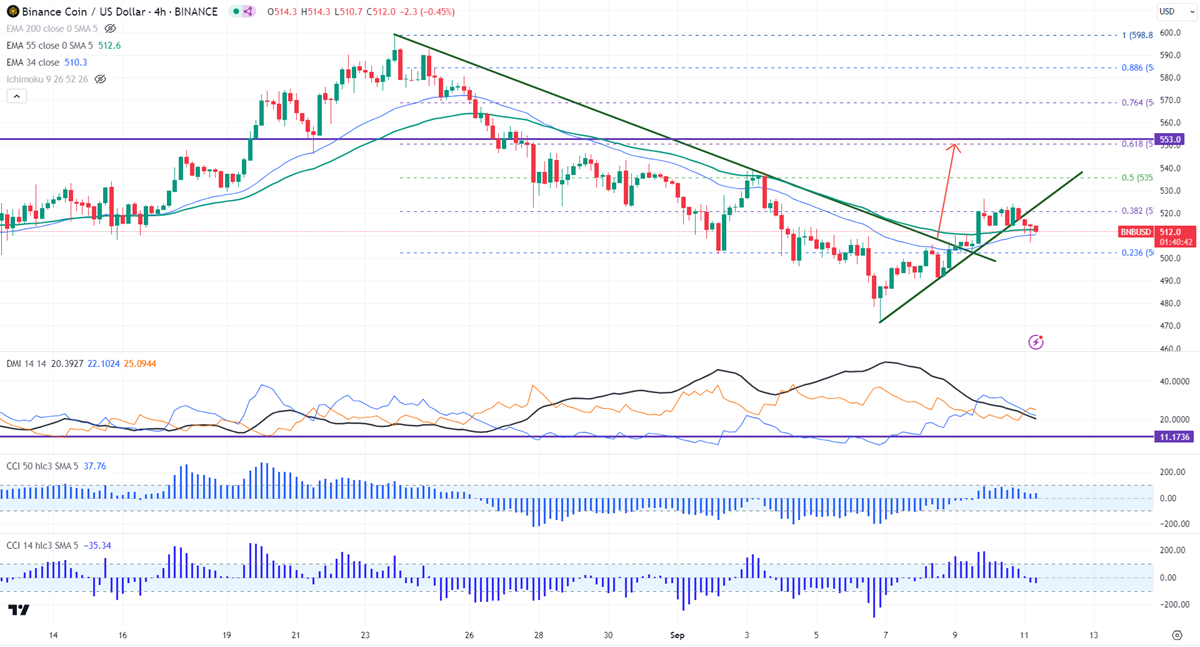
Intraday bias - Bullish
Horizontal trend line- $605
Any close above $555 confirms intraday bullishness.
BNBUSD recovered above $520 on anticipation of the release of ex-Binance CEO release. The pair holds above 34 and 55 EMA in the 4-hour chart. It hit a high of $526 and is currently trading around $519.40.
The intraday bearish trend continuation can happen if the pair breaks $470. On the lower side, the near-term support is $490. Any break below targets $470/$456 (127.2% fib)/$437 (1.618% fib)/$403 is possible.
The immediate resistance stands at around $529.40 (200- 4H EMA). Any breach above confirms minor bullishness. A jump to $540.70 (200- 8H EMA)/$551 (61.% fib) is possible. Bullish continuation only if it breaks $551. A surge past $551 will take it to $569/$605/$700.
Indicators ( 4-Hour chart)
Directional movement index -Neutral
CCI (50)- Bullish
CCI(14)- Bullish
It is good to buy on dips around $500 with SL around $470 for TP of $605/$700.


