


 FxWirePro- Major Crypto levels and bias summary
  FxWirePro- Major Crypto levels and bias summary
  Ethereum Tumbles Below $2K: Bears Eye $1,700 as All Key EMAs Flip Red
  Ethereum Cracks Below $2,000 as Bitcoin Contagion Bites—Bearish EMA Stack Sets Sights on $1,700
  Ether Breaks Below $2,100: Triple EMA “Sell-the-Rally” Setup Targets $1,900
  Bitcoin Bleeds $704M in ETF Outflows as Institutional Exodus Accelerates
  ETH Cracks $2,100 in Bitcoin’s Wake as Bearish EMA Stack Deepens; Sellers Target $1,900 on Rallies
  FxWirePro- Major Crypto levels and bias summary


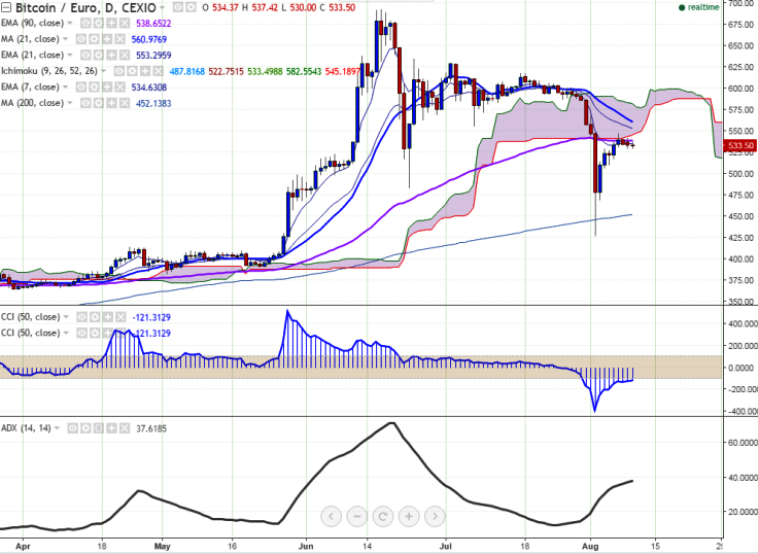
BTC/EUR is seen trading in red on Wednesday. The pair has declined slightly after making a high of 542.50 levels (CEXIO) on Aug 9th, 2016. It is currently trading around 533.91 at the time of writing.
Ichimoku analysis of daily chart shows:
Tenkan-Sen level: 497.48
Kijun-Sen level: 522.75
Trend reversal level - (90 days EMA)-538.76
Long-term trend remains to be bullish. In the daily chart, BTC/EUR is trading slightly above Tenken-Sen and Kijun-Sen. The pair should close above 21 days EMA for further bullishness.
Major resistance is around 555 (21 days EMA) and any break above will take the pair to next immediate resistance at 564 (21 days MA)/587 (61.8% retracement of 689 and 427). Short-term support – 504 (23.6% retracement of 529.50 and 427) and any break below targets 480 (Jun 23rd low)/451 (200 days MA).

- News

- Economy

- Central Banks
- Investing
- Research
- Roundups
- Digital Currency
- Insights
- Technical Analysis
- Technology
- Business
- Law
- Health
- Nature
- Fintech
- Science
- Topic
- Opinions
- ©Econometrics LLC . All Rights Reserved.
FxWirePro: BTC/EUR faces strong resistance at 21-day EMA, good to buy on dips
Wednesday, August 10, 2016 7:32 AM UTC
Editor's Picks


- Market Data
Most Popular


