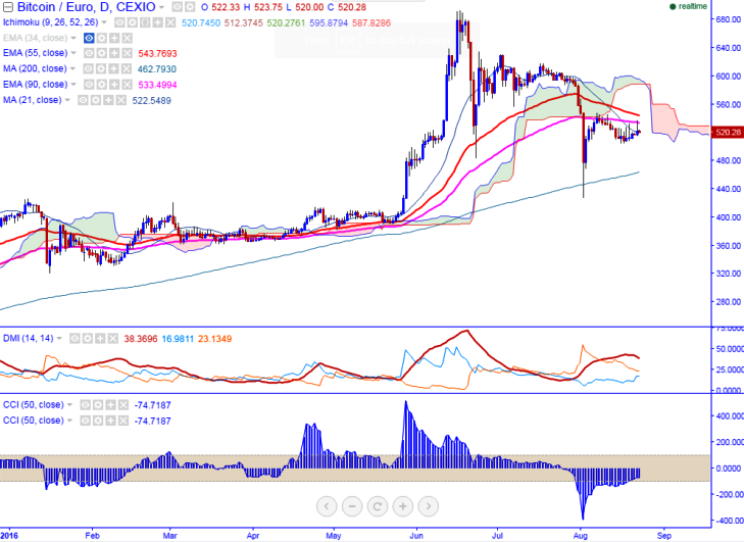
BTC/EUR is seen trading in red on Tuesday. The pair has jumped till 537 yesterday and started to decline from that level (CEXIO). It is currently trading around 520.28 at the time of writing.
Ichimoku analysis of daily chart shows:
Tenkan-Sen level: 520.74
Kijun-Sen level: 513.62
Trend reversal level - (90 days EMA)-533.79
Long-term trend remains to be bullish. In the daily chart, BTC/EUR is facing strong resistance at 545 (55-day EMA) and any violation below confirms minor bullishness.
Major resistance is around 535 (90 – day EMA) and any violation above will take the pair till 545 (55 days EMA)/555 (61.8% retracement of 635 and 427).The pair should close above 555 for further bullishness.
Short term support is seen at 500 and any break below targets 480 (Jun 23rd low)/458 (200 day MA).