


 FxWirePro- Major Crypto levels and bias summary
  Ethereum Cracks Under $1,700: Sell the Rally Near $1,750 as Bears Eye $1,380–$1,200
  BTC’s Bear Bounce: Sell the Rally Near $66K as Bears Target $59K–$52K Breakdown


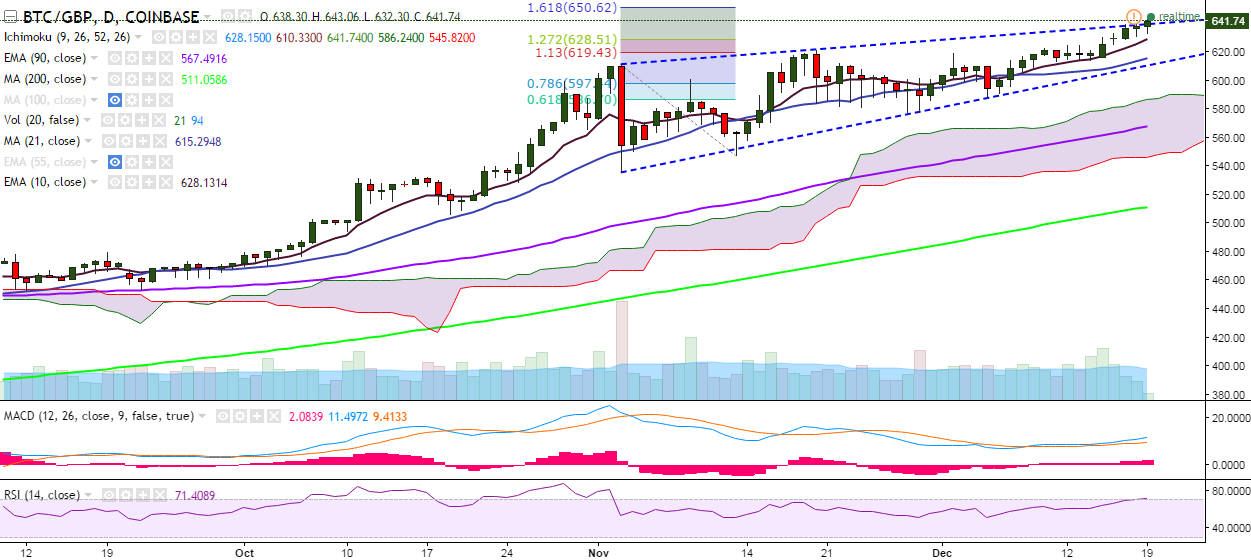
BTC/GBP broke above the trend line resistance on Monday and has hit a high of 643.06 levels so far in the day. It is currently trading at 641 levels at press time (Coinbase).
Long-term trend: Bullish
Short-term trend: Bullish
Ichimoku analysis of daily chart:
Tenkan Sen: 626.61
Kijun Sen: 608.79
Trend reversal: 565.82 (90 EMA)
On the upside, the pair has broken above the trend line joining 611.12 and 621.47 and further strength would see it testing 650 (161.8% retracement of 611.12 and 547.20)/662.14 (161.8% retracement of 549.45 and 367.10)/700.
On the reverse side, the pair has taken support near 625.10 (10-EMA) and a break below would drag it to 613 (21-DMA)/588.68 (December 05 low).

- News

- Economy

- Central Banks
- Investing
- Research
- Roundups
- Digital Currency
- Insights
- Technical Analysis
- Technology
- Business
- Law
- Health
- Nature
- Fintech
- Science
- Topic
- Opinions
- ©Econometrics LLC . All Rights Reserved.
FxWirePro: BTC/GBP breaches trend line resistance, good to buy on dips
Monday, December 19, 2016 9:24 AM UTC
Editor's Picks


- Market Data
Most Popular


