


 Bitcoin Cracks $75K as $1.3B ETF Exodus and Middle East Jitters Spook Bulls; Bears Eye $70K
  Ether Breaks Below $2,100: Triple EMA “Sell-the-Rally” Setup Targets $1,900
  FxWirePro- Major Crypto levels and bias summary
  Ethereum Cracks Below $2,000 as Bitcoin Contagion Bites—Bearish EMA Stack Sets Sights on $1,700
  Ethereum Tumbles Below $2K: Bears Eye $1,700 as All Key EMAs Flip Red
  FxWirePro- Major Crypto levels and bias summary


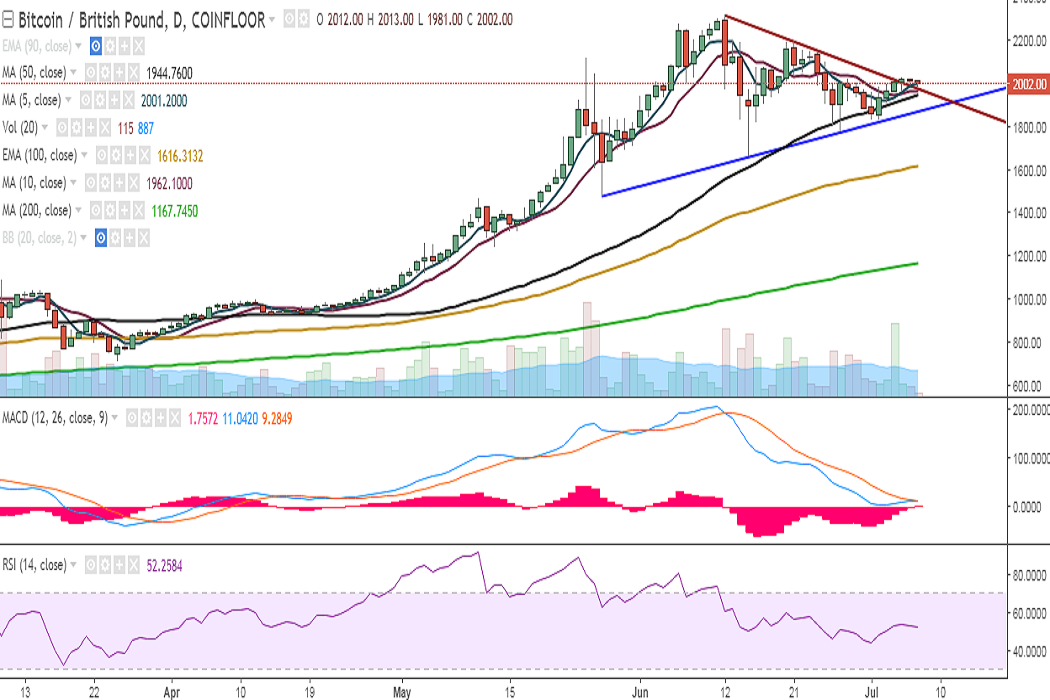
BTC/GBP continues trading in an extremely narrow range seen from the past couple of sessions. It is currently trading at 1999 levels at the time of writing (Coinfloor).
Ichimoku analysis of daily chart:
Tenkan Sen: 1928
Kijun Sen: 1986
On the upside, the pair faces strong resistance at 2042 (4h 200-SMA) and a break above would see it testing 2063 (61.8% retracement of 2315 and 1657)/2118 (May 25 high). Further strength would see it soaring to 2193 (June 21 high)/2247 (113% retracement of 2193 and 1777).
On the flipside, immediate support is seen at 1961 (10-DMA) and any violation would target 1944 (50-DMA) 1895 (50% retracement of 1475 and 2315. Further weakness would drag it to 1857 (trend line joining 1475 and 1657)/1830 (July 02 low).
Momentum studies: On the daily chart, RSI is at 52 with slightly lower bias and MACD appears flat.
On the weekly charts, the pair’s upside is capped by 5-SMA and a break above would see further bullishness. RSI continues to hold above 70 and MACD line is above the signal line.
Recommendation: Wait for clear directional bias.
FxWirePro launches Absolute Return Managed Program. For more details, visit http://www.fxwirepro.com/invest

- News

- Economy

- Central Banks
- Investing
- Research
- Roundups
- Digital Currency
- Insights
- Technical Analysis
- Technology
- Business
- Law
- Health
- Nature
- Fintech
- Science
- Topic
- Opinions
- ©Econometrics LLC . All Rights Reserved.
FxWirePro: BTC/GBP faces strong resistance at 4H 200-SMA, further bullishness only on break above
Friday, July 7, 2017 10:13 AM UTC
Editor's Picks


- Market Data
Most Popular


