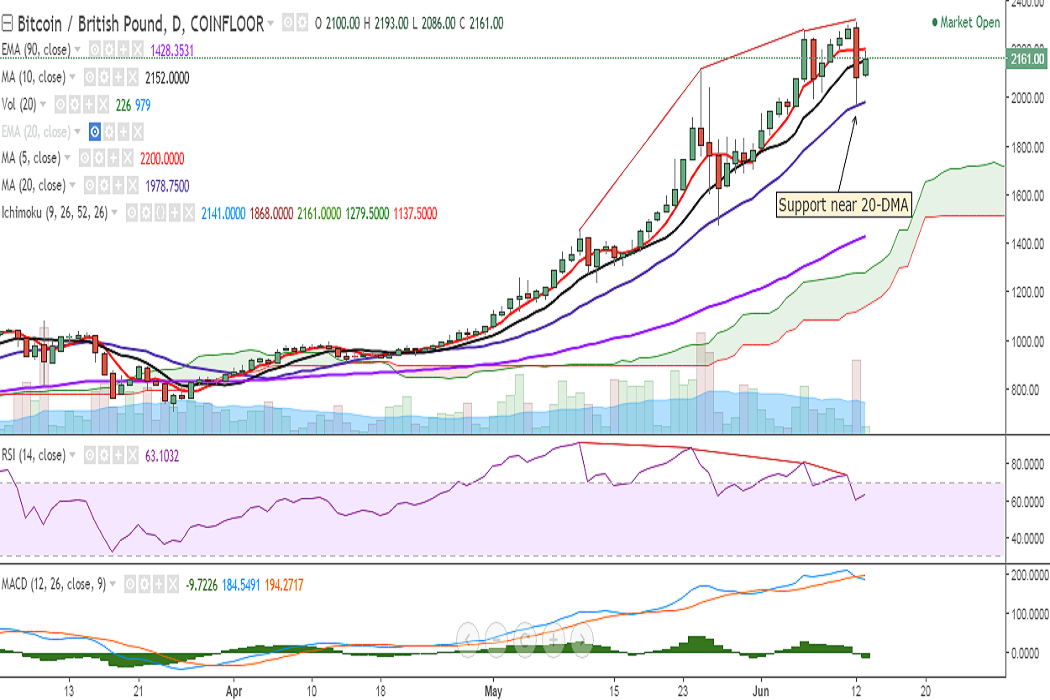
BTC/GBP dropped to 1969 levels on Monday after it hit a fresh all-time high at 2315 levels. It is currently trading at 2178 levels at the time of writing (Coinfloor).
Ichimoku analysis of daily chart:
Tenkan Sen: 2141
Kijun Sen: 1868
On the upside, the pair now faces resistance at 2200 levels (5-DMA) and a consistent break above would see it testing 2277 (June 06 high)/2292 (127.2% retracement of 2118 and 1475)/2315 (June 12 high)/2381 (113% extension of 1475 and 2277).
On the daily chart, RSI is strong at 63, while bearish MACD crossover could be seen. Importantly, multiple bearish RSI divergence could be seen on the daily chart. On the 4-hour chart, MACD line is below the signal line, RSI is flat at 48, while stochs suggest higher bias.
Support is seen at 2059 (4h 90-EMA) and a break below will drag it to 1969 levels (June 12 low)/1876 (50% retracement of 1475 and 2277)/1781.
Recommendation: Traders are preferred to wait for a confirmed signal on the daily chart.