


 FxWirePro- Major Crypto levels and bias summary
  Bitcoin Bleeds $704M in ETF Outflows as Institutional Exodus Accelerates
  FxWirePro- Major Crypto levels and bias summary
  FxWirePro- Major Crypto levels and bias summary
  ETH Cracks $2,100 in Bitcoin’s Wake as Bearish EMA Stack Deepens; Sellers Target $1,900 on Rallies
  Ethereum Cracks Below $2,000 as Bitcoin Contagion Bites—Bearish EMA Stack Sets Sights on $1,700
  Bitcoin Buckles at $73,500: Middle East Tensions and Weak Institutional Demand Set Bearish EMA Stack on $70K Collision Course
  Ether Breaks Below $2,100: Triple EMA “Sell-the-Rally” Setup Targets $1,900


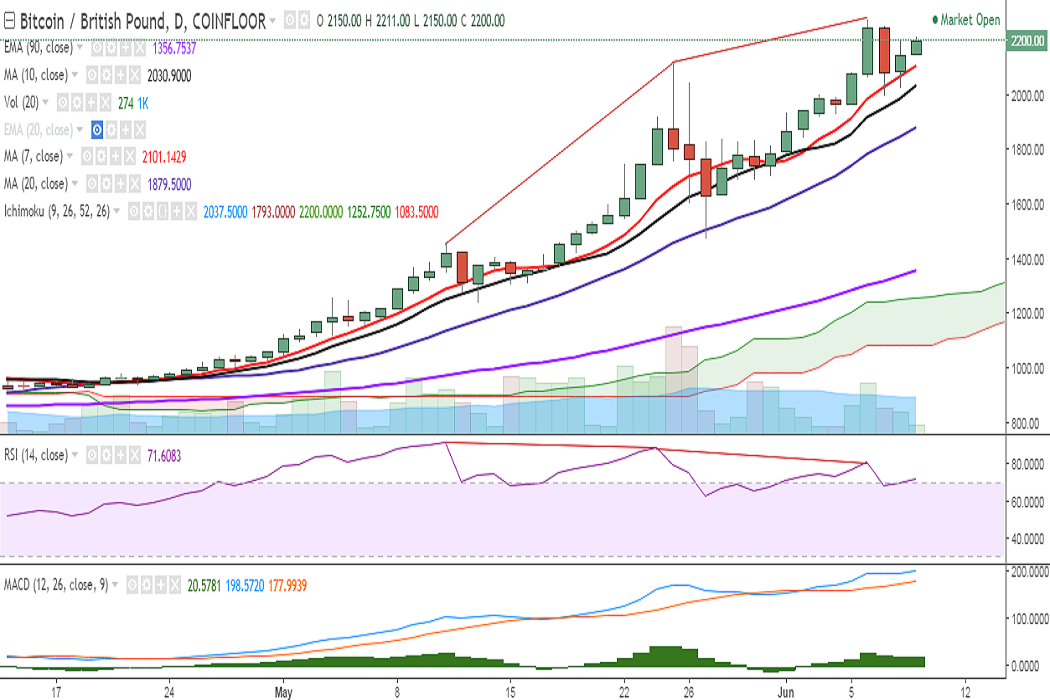
BTC/GBP in trading is trading slightly higher on Friday as it once again broke above 2200 mark. It is hovering this levels and is currently trading at 2192 levels at press time (Coinfloor).
Ichimoku analysis of daily chart:
Tenkan Sen: 2037.50
Kijun Sen: 1793
On the upside, a close above 2200 levels would see the pair testing 2277 (June 06 high)/2292 (127.2% retracement of 2118 and 1475)/2381 (113% extension of 1475 and 2277)/2495.
Momentum studies appear bullish on the daily chart with RSI strong at 71, MACD line above the signal line, and the pair holding above 7-DMA). However, caution is advised as RSI and Stochs are in the overbought zone. Also, bearish divergence in RSI and stochs could be seen on daily chart.
Support is seen at 2154 (2h 50-SMA) and any violation would see a dip till 2101 (7-DMA)/2069 (2h 90-EMA)/2030 (10-DMA)/1879 (20-DMA).

- News

- Economy

- Central Banks
- Investing
- Research
- Roundups
- Digital Currency
- Insights
- Technical Analysis
- Technology
- Business
- Law
- Health
- Nature
- Fintech
- Science
- Topic
- Opinions
- ©Econometrics LLC . All Rights Reserved.
FxWirePro: BTC/GBP hovers around 2200, close above targets 2381
Friday, June 9, 2017 10:53 AM UTC
Editor's Picks


- Market Data
Most Popular


