


 FxWirePro- Major Crypto levels and bias summary
  FxWirePro- Major Crypto levels and bias summary
  FxWirePro- Major Crypto levels and bias summary


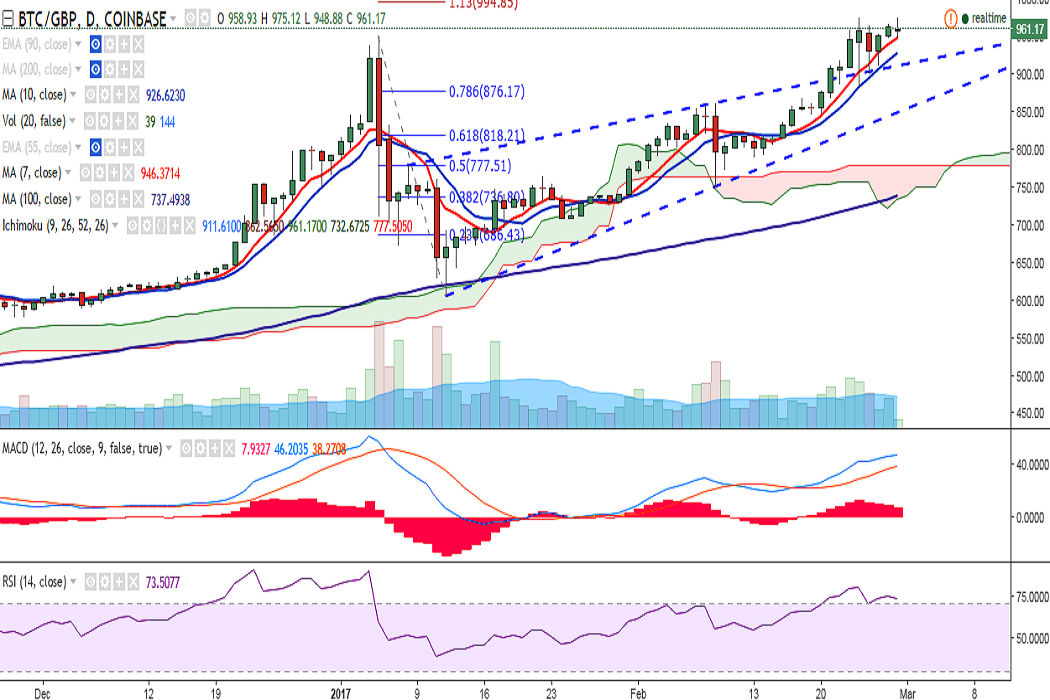
BTC/GBP is trading rangebound on Tuesday. It slightly broke above the previous high of 975 levels, hitting 975.11 levels, but failed to hold its strength. It is currently trading at 960 levels at press time (Coinbase).
Ichimoku analysis of daily chart:
Tenkan Sen: 910.94
Kijun Sen: 862.52
Overall trend appears bullish, however, further upside could be confirmed only if the pair closes above 975 levels. Further strength would see it testing 1000 (psychological level)/1043 (127.2% retracement of 950 and 650).
Some intraday weakness could be seen in the intraday day charts. In the 1H chart, the pair is trading below 1H 7-SMA and could see dip till 950 (1H 100-SMA). Any dip could be seen as a buying opportunity as weekly charts suggest bullish bias.
In the daily chart, support is seen at 938.80 (7-DMA) and a close below could see slight weakness till 916.18 (10-DMA)/868 (20-DMA).

- News

- Economy

- Central Banks
- Investing
- Research
- Roundups
- Digital Currency
- Insights
- Technical Analysis
- Technology
- Business
- Law
- Health
- Nature
- Fintech
- Science
- Topic
- Opinions
- ©Econometrics LLC . All Rights Reserved.
FxWirePro: BTC/GBP largely unchanged, takes support near 7-DMA, slight weakness on close below
Tuesday, February 28, 2017 10:36 AM UTC
Editor's Picks


- Market Data
Most Popular


