


 Bitcoin Bleeds $704M in ETF Outflows as Institutional Exodus Accelerates
  FxWirePro- Major Crypto levels and bias summary
  Ether Breaks Below $2,100: Triple EMA “Sell-the-Rally” Setup Targets $1,900
  Ethereum Cracks Below $2,000 as Bitcoin Contagion Bites—Bearish EMA Stack Sets Sights on $1,700
  FxWirePro- Major Crypto levels and bias summary
  ETH Cracks $2,100 in Bitcoin’s Wake as Bearish EMA Stack Deepens; Sellers Target $1,900 on Rallies
  FxWirePro- Major Crypto levels and bias summary
  FxWirePro- Major Crypto levels and bias summary
  Bitcoin Cracks $75K as $1.3B ETF Exodus and Middle East Jitters Spook Bulls; Bears Eye $70K


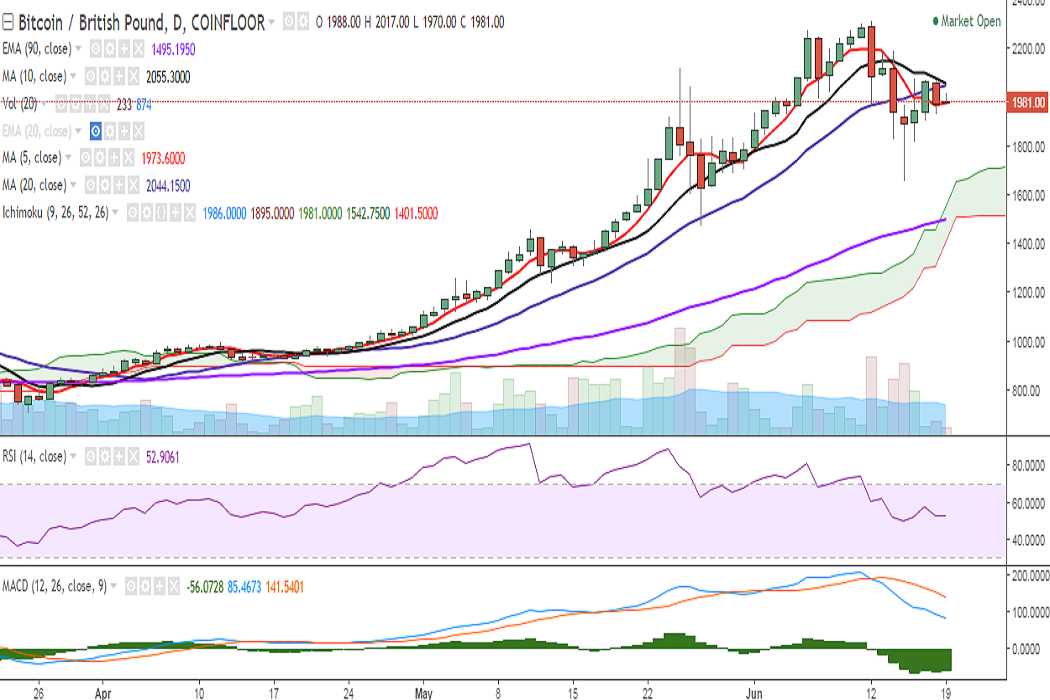
BTC/GBP is trading in a narrow range on Monday as its upside is capped by 10-DMA. It is currently trading at 1977 levels at the time of writing (Coinfloor).
Ichimoku analysis of daily chart:
Tenkan Sen: 1986
Kijun Sen: 1895
On the upside, the pair faces resistance at 2054 (10-DMA) and a break above would target 2118 (May 25 high)/2174 (78.6% retracement of 2315 and 1657)/2277 (June 06 high)/2315 (June 12 high).
On the flipside, support is seen at 1948 (2h 50-DMA) and any violation would drag it to 1892 (4h 200-SMA)/1795 (61.8% retracement of 1475 and 2315). Further weakness would see it testing 1688 (50-DMA)/1657 (June 15 low).
Momentum studies: On the daily chart, RSI and stochs suggest higher bias, while the MACD line is below the signal line. However, the downward momentum of MACD appears to be waning.
On the weekly chart, the pair is hovering around 5-SMA. Momentum studies appear bullish with RSI holding and the MACD line above the signal line. A close below 5-SMA coupled with a rollover of RSI from overbought zone is likely to see further downside in the pair.
Recommendation: A decisive break above 2054 (20-DMA) is likely to see further upside in the pair.

- News

- Economy

- Central Banks
- Investing
- Research
- Roundups
- Digital Currency
- Insights
- Technical Analysis
- Technology
- Business
- Law
- Health
- Nature
- Fintech
- Science
- Topic
- Opinions
- ©Econometrics LLC . All Rights Reserved.
FxWirePro: BTC/GBP rangebound, consistent break above 10-DMA targets 2315
Monday, June 19, 2017 10:22 AM UTC
Editor's Picks


- Market Data
Most Popular


