


 Bitcoin Cracks $75K as $1.3B ETF Exodus and Middle East Jitters Spook Bulls; Bears Eye $70K
  Ethereum Cracks Below $2,000 as Bitcoin Contagion Bites—Bearish EMA Stack Sets Sights on $1,700
  ETH Cracks $2,100 in Bitcoin’s Wake as Bearish EMA Stack Deepens; Sellers Target $1,900 on Rallies
  Bitcoin Buckles at $73,500: Middle East Tensions and Weak Institutional Demand Set Bearish EMA Stack on $70K Collision Course


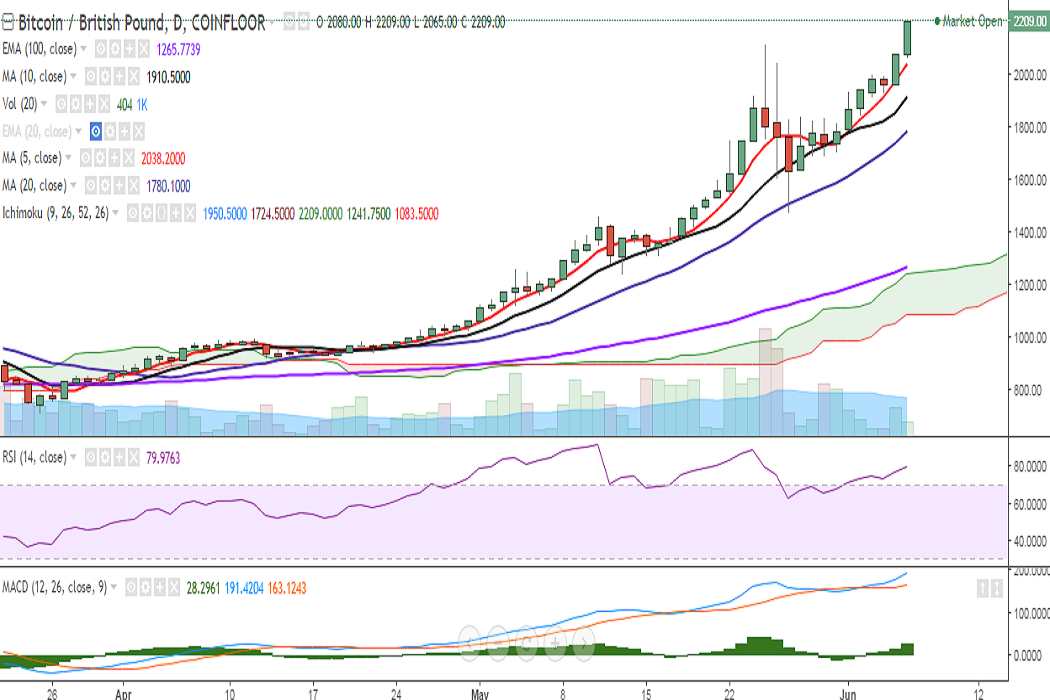
BTC/GBP surpassed the previous high of 2118 levels to hit a fresh all-time high at 2209 levels, where it currently trades (Coinfloor).
Ichimoku analysis of daily chart:
Tenkan Sen: 1950
Kijun Sen: 1724
On the upside, the pair faces resistance at 2232 (113% extension of 1240 and 2118) and a break above would see it testing 2292 (127.2% retracement of 2118 and 1475)/2356/2515.
Momentum studies appear bullish on the daily chart: RSI is strong at 79, stochs suggest higher bias, and MACD line is above the signal line. However, as bearish RSI divergence could be seen on the daily charts, traders are advised to watch out for turns in major indicators.
Support is seen at 2169 (1h 10-SMA) and a break below would drag it to 2109 (1h 20-SMA)/2033 (1h 50-SMA).
On the daily chart, major support is seen at 2038 (5-DMA) and a break below would target 1910.50 (10-DMA)/1780 (20-DMA).

- News

- Economy

- Central Banks
- Investing
- Research
- Roundups
- Digital Currency
- Insights
- Technical Analysis
- Technology
- Business
- Law
- Health
- Nature
- Fintech
- Science
- Topic
- Opinions
- ©Econometrics LLC . All Rights Reserved.
FxWirePro: BTC/GBP trades higher, break above 113% fib targets 2356
Tuesday, June 6, 2017 9:39 AM UTC
Editor's Picks


- Market Data
Most Popular


