


 FxWirePro- Major Crypto levels and bias summary
  FxWirePro- Major Crypto levels and bias summary
  FxWirePro- Major Crypto levels and bias summary
  BTC’s Bear Bounce: Sell the Rally Near $66K as Bears Target $59K–$52K Breakdown
  Ethereum Cracks Under $1,700: Sell the Rally Near $1,750 as Bears Eye $1,380–$1,200
  FxWirePro- Major Crypto levels and bias summary


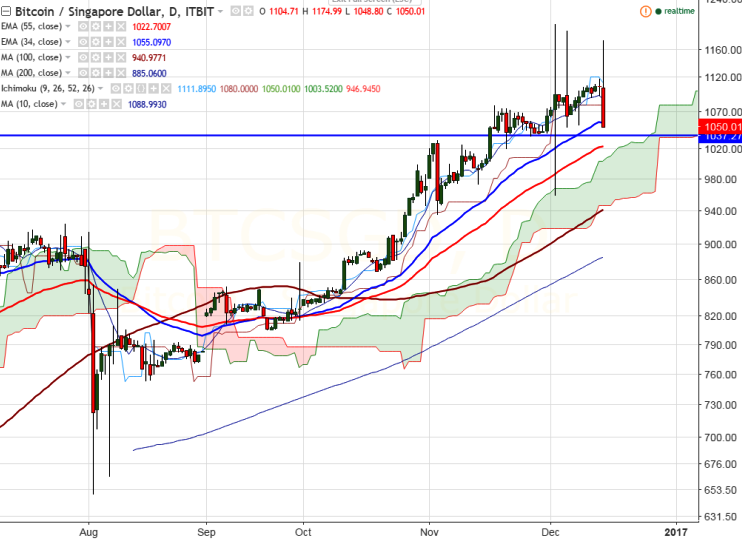
BTC/SGD is seen trading well above on Wednesday. The pair has once again declined sharply after jumping till 1174 (ITBIT). It is currently trading around 1163.97 at the time of writing.
Long-term trend remains to be bullish.
Ichimoku analysis of daily chart shows:
Tenkan-Sen level: 1119.40
Kijun-Sen level: 1080
Trend reversal level - (100 day MA) – 916
BTC/SGD faces strong resistance around 1200 and any further bullishness can be seen only above that level.
Minor resistance is around 1093 (10- day MA) any break above that level will take the pair to next level till 1119 (daily Tenken-Sen)/1160 (127.2% retracement of 1051.92 and 650)/1204. Short-term support is seen at 1048 (Dec 5th, 2016 low) and any break below targets 1037 (61.8% retracement of 936 and 1200)/1021.68 (55- day EMA).

- News

- Economy

- Central Banks
- Investing
- Research
- Roundups
- Digital Currency
- Insights
- Technical Analysis
- Technology
- Business
- Law
- Health
- Nature
- Fintech
- Science
- Topic
- Opinions
- ©Econometrics LLC . All Rights Reserved.
FxWirePro: BTC/SGD faces strong resistance at 1200, good to sell on rallies
Wednesday, December 14, 2016 12:11 PM UTC
Editor's Picks


- Market Data
Most Popular


