


 Ethereum Cracks Under $1,700: Sell the Rally Near $1,750 as Bears Eye $1,380–$1,200
  FxWirePro- Major Crypto levels and bias summary


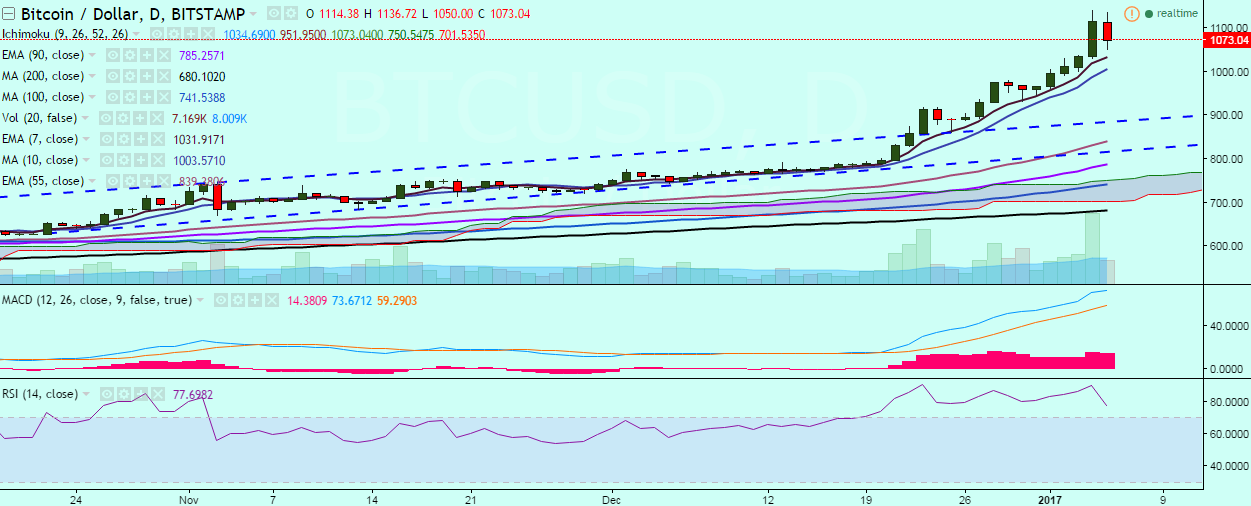
BTC/USD hit a fresh high of 1,139 levels on Wednesday before closing at 1,114 levels. The pair failed to hold its strength and is currently trading in the red at 1,071 levels at press time (Bitstamp).
Long-term trend: Bullish
Short-term trend: Bullish
Ichimoku analysis of daily chart:
Tenkan Sen: 1015.44
Kijun Sen: 951.95
Trend reversal: 778.79 (90 EMA)
The pair need to break above yesterday’s high of 1,139 levels for further upside, which would then target 1,163 levels (all time high so far seen on 30 November 2013)/1,200.
Momentum studies remain positive:
- MACD line is well above signal line
- RSI(14) is at 79
On the reverse side, the pair is likely to take support at 1,018.20 (7-EMA) and a break below would see it testing 985.97 (10-DMA)/931 (December 30 low).


