


 FxWirePro- Major Crypto levels and bias summary
  BTC’s Bear Bounce: Sell the Rally Near $66K as Bears Target $59K–$52K Breakdown


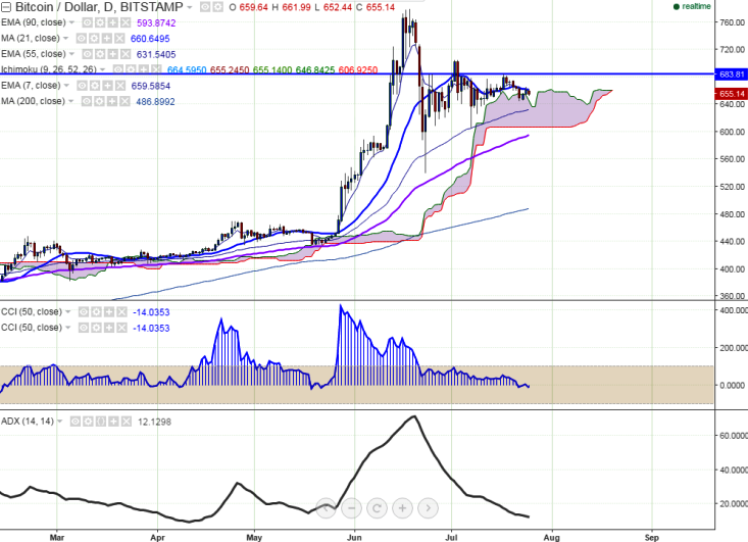
BTC/USD is seen trading below in red on Monday. The pair has recovered after making a low of $645 levels (BITSTAMP) on Tuesday. It is currently trading at $655.18 at the time of writing.
Ichimoku analysis of daily chart shows:
Tenkan-Sen level: $664.50
Kijun-Sen level: $655.24
Trend reversal level - (90 EMA)-$592.94
The long-term trend remains to be bullish. BTC/USD is facing strong support at $630 (55 days EMA).It should break below this level for further weakness.
Major resistance is around $665 (daily Tenken-Sen) and any break above targets $685 (Jun25th high)/ $705 (Jul 2nd high). Short term support is seen at $645 (Jul 22nd low) and any violation below will drag the pair till $630 (55 days EMA)/$605 (Jul 7th low).

- News

- Economy

- Central Banks
- Investing
- Research
- Roundups
- Digital Currency
- Insights
- Technical Analysis
- Technology
- Business
- Law
- Health
- Nature
- Fintech
- Science
- Topic
- Opinions
- ©Econometrics LLC . All Rights Reserved.
FxWirePro: BTC/USD faces strong support at 55 day EMA, good to buy the dips
Monday, July 25, 2016 7:12 AM UTC
Editor's Picks


- Market Data
Most Popular


