


 ETH Cracks $2,100 in Bitcoin’s Wake as Bearish EMA Stack Deepens; Sellers Target $1,900 on Rallies
  FxWirePro- Major Crypto levels and bias summary
  Bitcoin Cracks $75K as $1.3B ETF Exodus and Middle East Jitters Spook Bulls; Bears Eye $70K
  FxWirePro- Major Crypto levels and bias summary
  FxWirePro- Major Crypto levels and bias summary
  Ether Breaks Below $2,100: Triple EMA “Sell-the-Rally” Setup Targets $1,900


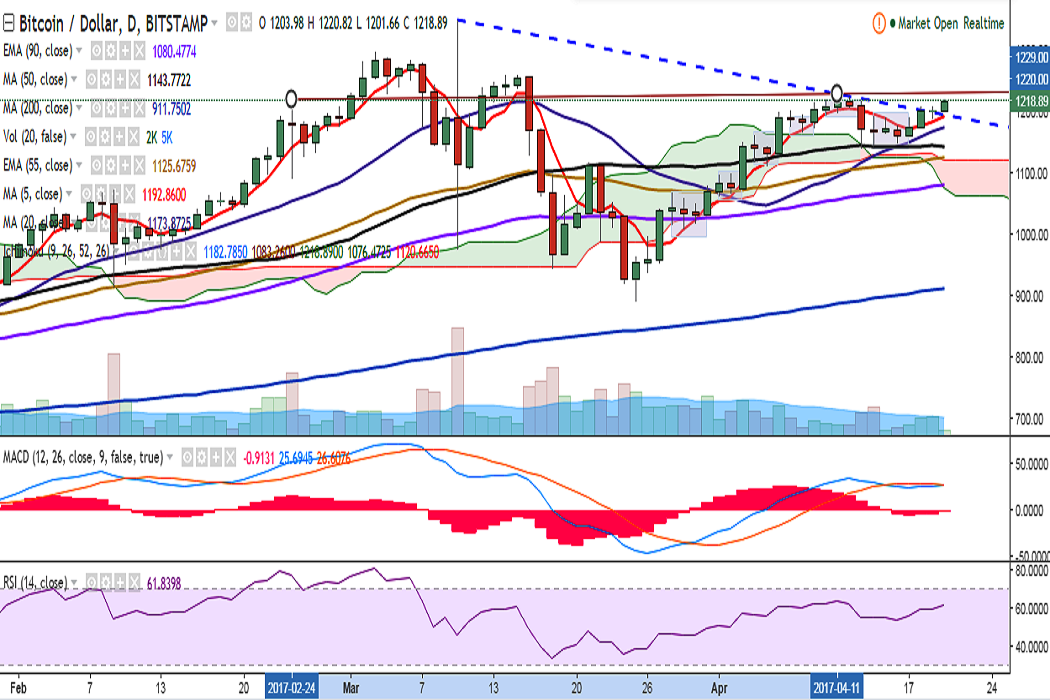
BTC/USD has broken above the trend line joining 1350 and 1229. It is currently trading at 1218 levels at the time of writing (Bitstamp).
Ichimoku analysis of daily chart:
Tenkan Sen: 1182.78
Kijun Sen: 1083.26
On the upside, the pair now faces resistance at 1230 (trend line joining 1220 and 1229) and a consistent break above would see it testing 1260 (March 15 high)/1298 (March 03 high).
Momentum studies appear bullish with RSI strong at 61, MACD on the verge of a bullish crossover, and stochs appear to be rolling over to overbought zone.
On the downside, support is seen at 1192 (5-DMA) and any violation would see a dip till 1173.75 (20-DMA)/1143.72 (50-DMA).

- News

- Economy

- Central Banks
- Investing
- Research
- Roundups
- Digital Currency
- Insights
- Technical Analysis
- Technology
- Business
- Law
- Health
- Nature
- Fintech
- Science
- Topic
- Opinions
- ©Econometrics LLC . All Rights Reserved.
FxWirePro: BTC/USD faces trend line resistance at 1230, break above targets 1260
Thursday, April 20, 2017 9:28 AM UTC
Editor's Picks


- Market Data
Most Popular


