


 Bitcoin Bleeds $704M in ETF Outflows as Institutional Exodus Accelerates
  FxWirePro- Major Crypto levels and bias summary
  Ethereum Cracks Below $2,000 as Bitcoin Contagion Bites—Bearish EMA Stack Sets Sights on $1,700
  Bitcoin Cracks $75K as $1.3B ETF Exodus and Middle East Jitters Spook Bulls; Bears Eye $70K


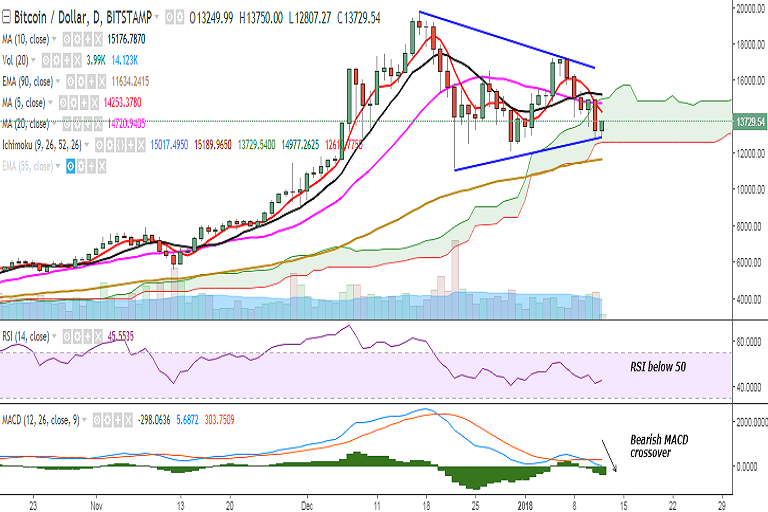
BTC/USD is trading in the green on Friday and holding well above 13000 levels. It is currently trading at 13729 levels at the time of writing (Bitstamp).
Ichimoku analysis of daily chart:
Tenkan Sen: 15017.49
Kijun Sen: 15189.96
On the topside, resistance is seen at 13837 (1h 50-SMA) and a break above would target 14225 (5-DMA)/14714 (20-DMA). Further strength would see it testing 15162 (10-DMA)/15412 (50% retracement of 19666 and 11159.93)/16000/16490 (trend line joining 19666 and 17234).
On the flipside, a break below 12800 (January 11 low) would see the pair testing 12610 (Cloud bottom)/12430 (lower Bollinger). Further weakness would drag the pair to 12050 (December 30 low)/11631 (90-EMA).
Momentum studies: Bias remains bearish on the daily chart with RSI at 45, MACD line below the signal line, and stochs biased lower.
Intraday bias appears to be slightly bullish as on the 1h chart, MACD line is above the signal line, RSI is at 51 and stochs are biased higher.
Watch out for a break below cloud for further downside in the pair. If the pair succeeds to retrace above 20-DMA there would be further upside possibility.
FxWirePro launches Absolute Return Managed Program. For more details, visit http://www.fxwirepro.com/invest

- News

- Economy

- Central Banks
- Investing
- Research
- Roundups
- Digital Currency
- Insights
- Technical Analysis
- Technology
- Business
- Law
- Health
- Nature
- Fintech
- Science
- Topic
- Opinions
- ©Econometrics LLC . All Rights Reserved.
FxWirePro: BTC/USD finds support at 12800, break below cloud confirms bearishness
Friday, January 12, 2018 6:26 AM UTC
Editor's Picks


- Market Data
Most Popular


