


 Bitcoin Cracks $75K as $1.3B ETF Exodus and Middle East Jitters Spook Bulls; Bears Eye $70K
  FxWirePro- Major Crypto levels and bias summary
  FxWirePro- Major Crypto levels and bias summary
  Ether Breaks Below $2,100: Triple EMA “Sell-the-Rally” Setup Targets $1,900
  Ethereum Cracks Below $2,000 as Bitcoin Contagion Bites—Bearish EMA Stack Sets Sights on $1,700
  Bitcoin Buckles at $73,500: Middle East Tensions and Weak Institutional Demand Set Bearish EMA Stack on $70K Collision Course
  FxWirePro- Major Crypto levels and bias summary
  FxWirePro- Major Crypto levels and bias summary
  ETH Cracks $2,100 in Bitcoin’s Wake as Bearish EMA Stack Deepens; Sellers Target $1,900 on Rallies
  FxWirePro- Major Crypto levels and bias summary


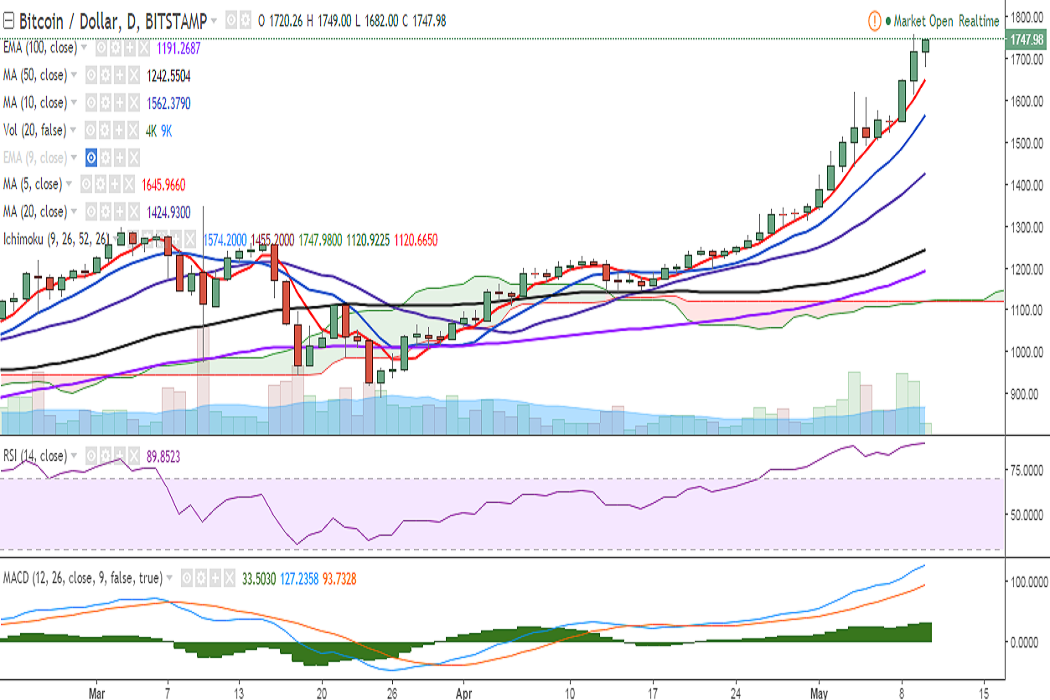
BTC/USD dropped to 182 levels earlier in the day before restoring strength to above the 1700 mark. It is currently trading at 1741 levels at the time of writing (Bitstamp).
Ichimoku analysis of daily chart:
Tenkan Sen: 1574.20
Kijun Sen: 1455.20
On the upside, the pair currently faces resistance at 1754 (127.2% extension of 1141 and 1623) and a break above would target 1800 (psychological)/1840 (113% extension of 1141 and 1760.40).
Overall trend is extremely bullish: RSI is holding at 89, bias higher; MACD line is above the signal line; and stochs are in the overbought zone. However, bearish RSI divergence on 4-hourly and weekly charts call for caution.
On the downside, support is seen at 1699.18 (2h 20-SMA) and a break below would see a dip till 1645.50 (5-DMA)/1614.12 (23.6% retracement of 1141 and 1760.40).

- News

- Economy

- Central Banks
- Investing
- Research
- Roundups
- Digital Currency
- Insights
- Technical Analysis
- Technology
- Business
- Law
- Health
- Nature
- Fintech
- Science
- Topic
- Opinions
- ©Econometrics LLC . All Rights Reserved.
FxWirePro: BTC/USD holds above 1700, jump till 1800 likely
Wednesday, May 10, 2017 9:16 AM UTC
Editor's Picks


- Market Data
Most Popular


