


 FxWirePro- Major Crypto levels and bias summary
  FxWirePro- Major Crypto levels and bias summary
  BTC’s Bear Bounce: Sell the Rally Near $66K as Bears Target $59K–$52K Breakdown


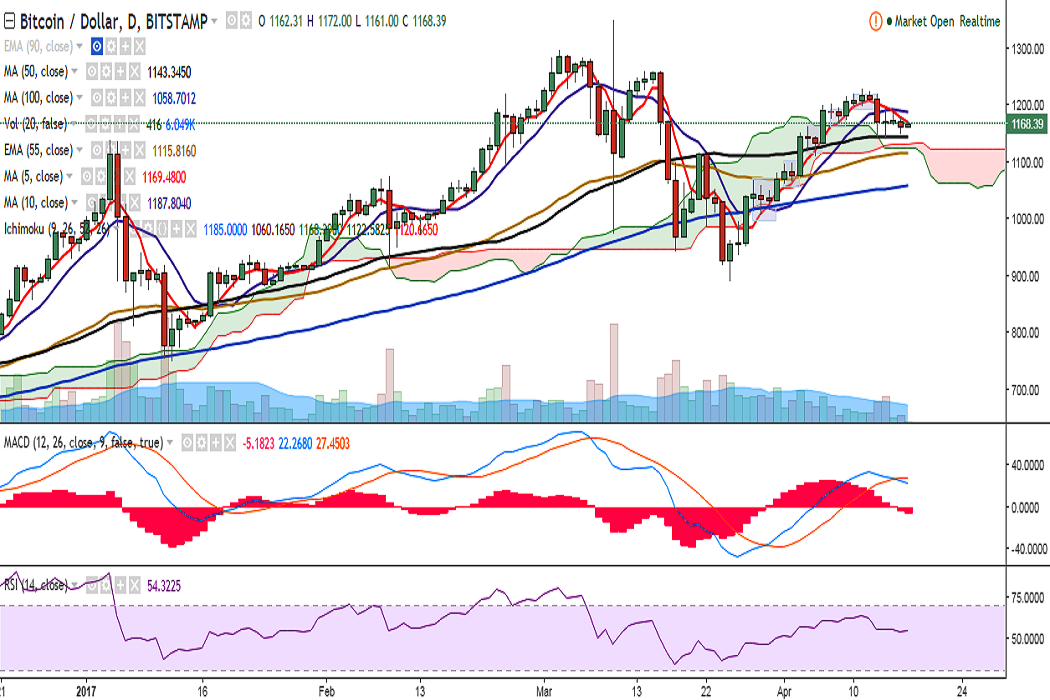
BTC/USD is trading in a tight range on Monday between 1161 and 1172 levels. It is currently trading at 1167 levels at the time of writing (Bitstamp).
Ichimoku analysis of daily chart:
Tenkan Sen: 1185
Kijun Sen: 1060.16
The pair’s upside is being capped by 1169.32 (5-DMA) and a consistent break above would see it testing 1187.72 (10-DMA)/ 1200 (psychological)/1229 (April 11 high).
Momentum studies suggest bearish bias with stochs pointing south, and bearish crossovers of MACD, and 5- and 10-DMA. RSI is holding above 50 and the pair has taken support near 50-DMA which suggests that we could see some consolidation around current levels.
The pair has taken support near 1143.33 (50-DMA) and a close below would see further bearishness in the pair, dragging it till 1115.80 (55-EMA)/1091.10 (February 24 low).

- News

- Economy

- Central Banks
- Investing
- Research
- Roundups
- Digital Currency
- Insights
- Technical Analysis
- Technology
- Business
- Law
- Health
- Nature
- Fintech
- Science
- Topic
- Opinions
- ©Econometrics LLC . All Rights Reserved.
FxWirePro: BTC/USD holds above 50-DMA, close below to see further downside
Monday, April 17, 2017 7:19 AM UTC
Editor's Picks


- Market Data
Most Popular


