FxWirePro: BTC/USD hovers around 10-DMA, bias neutral
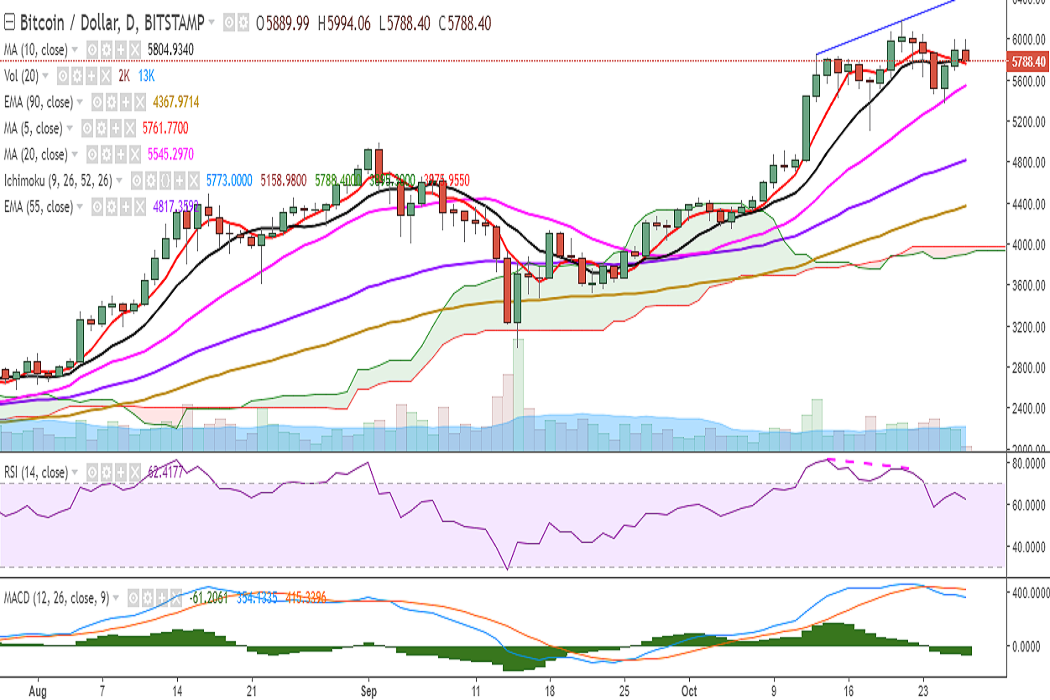
BTC/USD traded higher on Thursday and closed above 10-DMA at 5890 levels. It is currently trading at 5801 levels at the time of writing (Bitstamp). Ichimoku analysis of daily chart: Tenkan Sen: 5773 Kijun Sen: 5158.98 On…
BTC/USD traded higher on Thursday and closed above 10-DMA at 5890 levels. It is currently trading at 5801 levels at the time of writing (Bitstamp).
Ichimoku analysis of daily chart:
Tenkan Sen: 5773
Kijun Sen: 5158.98
On the upside, the pair faces strong resistance at 6005 (78.6% retracement of 6180 and 5366) and a break above would see it testing 6180 (October 21 high)/ 6220 (161.8% retracement of 4979.90 and 2972.01). Further strength would see it testing 6285/6400.
On the reverse side, support is seen at 5809 (10-DMA) and any violation would see it testing 5772 (5-DMA)/5617 (4h 100-SMA). Further weakness would see it testing 5547 (20-DMA)/5422 (23.6% retracement of 2972.01 and 6180)/5294 (1w 5-SMA).
Momentum studies: On the daily chart, the pair is holding above 10-DMA, RSI is strong at 64, while MACD line is below the signal line.
The $0.131 mark was the late-September high; a revisit would depend on Bitcoin (BTC) strengthening and crypto-market sentiment improving. No timeframe was given.
Binance US is reportedly seeking to raise up to $100 million in fresh funding at a valuation of approximately $1 billion as the cryptocurrency exchange looks to strengthen its position in the competitive U.S. market. Acc…