


 FxWirePro- Major Crypto levels and bias summary
  FxWirePro- Major Crypto levels and bias summary
  FxWirePro- Major Crypto levels and bias summary
  FxWirePro- Major Crypto levels and bias summary
  FxWirePro- Major Crypto levels and bias summary


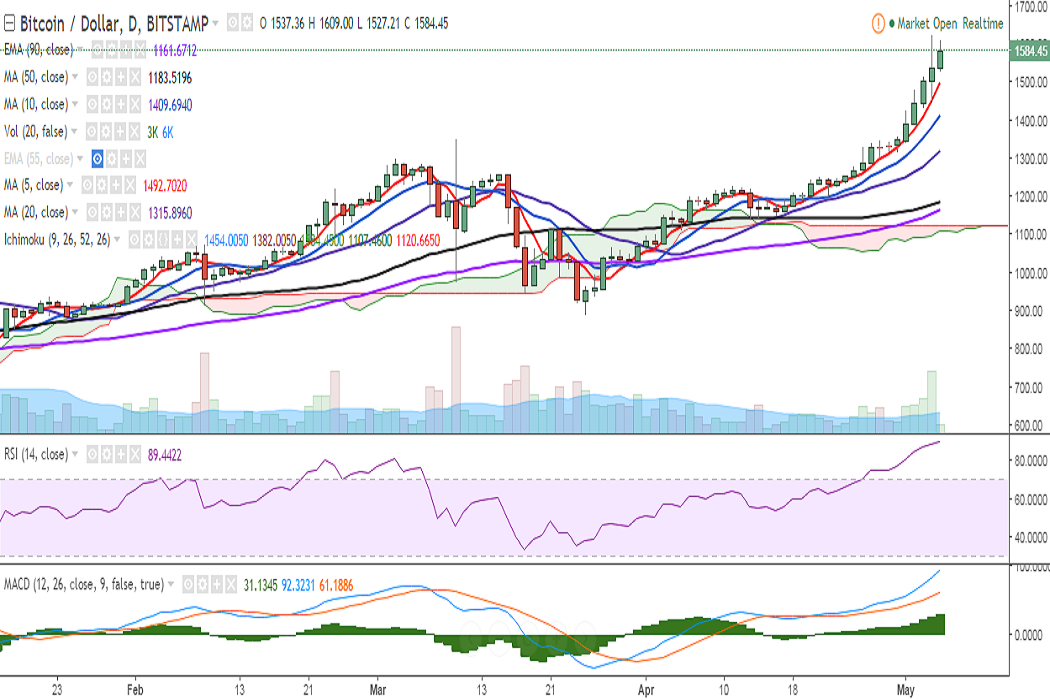
BTC/USD hit a fresh all-time high at 1623 levels on Thursday, before it closed at 1537 levels. It is currently hovering around 1600 levels at the time of writing (Bitstamp).
Ichimoku analysis of daily chart:
Tenkan Sen: 1454
Kijun Sen: 1382
On the upside, a close above 1600 levels would see the pair testing 1623 (May 04 high)/ 1633 (161.8% retracement of 1350 and 891.33). Further strength would see a jump till 1700 (psychological)/1718 (113% extension of 891.33 and 1623).
Caution is advised as lead indicators are in extremely overbought zone.
On the downside, support is seen at 1495 (5-DMA) and a break below would see a dip till 1450 (23.6% retracement of 891.33 and 1623)/1411.24 (10-DMA).

- News

- Economy

- Central Banks
- Investing
- Research
- Roundups
- Digital Currency
- Insights
- Technical Analysis
- Technology
- Business
- Law
- Health
- Nature
- Fintech
- Science
- Topic
- Opinions
- ©Econometrics LLC . All Rights Reserved.
FxWirePro: BTC/USD hovers around 1600, decisive break above targets 1633
Friday, May 5, 2017 7:28 AM UTC
Editor's Picks


- Market Data
Most Popular


