


 Ether Breaks Below $2,100: Triple EMA “Sell-the-Rally” Setup Targets $1,900
  FxWirePro- Major Crypto levels and bias summary
  Ethereum Cracks Below $2,000 as Bitcoin Contagion Bites—Bearish EMA Stack Sets Sights on $1,700
  Ethereum Tumbles Below $2K: Bears Eye $1,700 as All Key EMAs Flip Red
  FxWirePro- Major Crypto levels and bias summary
  Bitcoin Cracks $75K as $1.3B ETF Exodus and Middle East Jitters Spook Bulls; Bears Eye $70K
  FxWirePro- Major Crypto levels and bias summary


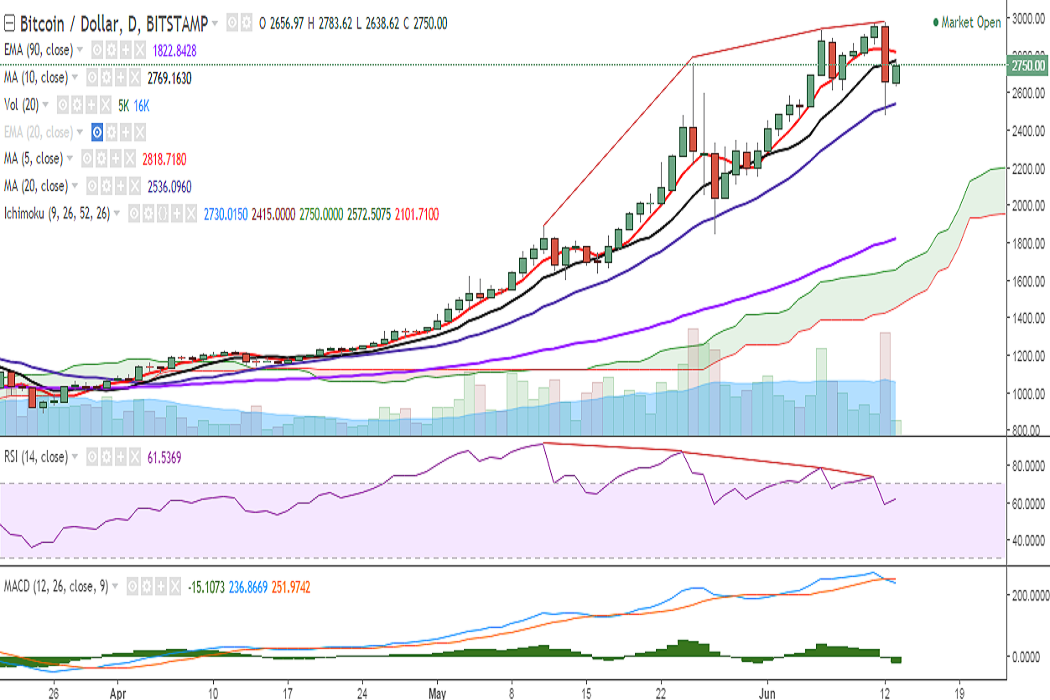
BTC/USD plummeted by $500 on Monday after it hit 2980 levels. It dropped to 2480 levels before closing at 2667 levels. It is currently trading at 2767 levels at the time of writing (Bitstamp).
Ichimoku analysis of daily chart:
Tenkan Sen: 2730
Kijun Sen: 2415
On the upside, the pair is currently hovering around 2771 (10-DMA) and a decisive break above would see it testing 2823 (5-DMA)/2878 (113% retracement 2760 and 1850)/ 2933 (June 06 high). Further strength would target 2980 (June 12 high)/ 3007.52 (127.2% retracement 2760 and 1850).
Momentum studies: On the 4-hour chart, RSI, MACD, and stochs suggesting higher bias. Also, the pair broke below the Ichimoku cloud on Monday, but has bounced back.
Caution is advised as multiple bearish RSI divergences and a bearish MACD crossover could be seen on the daily chart. Traders are preferred to wait for a confirmed signal on the daily.
Support is seen at 2635 (4h 90-EMA) and any violation would see the pair falling to 2573 (2h 200-SMA)/2537 (20-DMA)/2480 (June 12 low).

- News

- Economy

- Central Banks
- Investing
- Research
- Roundups
- Digital Currency
- Insights
- Technical Analysis
- Technology
- Business
- Law
- Health
- Nature
- Fintech
- Science
- Topic
- Opinions
- ©Econometrics LLC . All Rights Reserved.
FxWirePro: BTC/USD partially recovers losses, hovers around 10-DMA, bias neutral
Tuesday, June 13, 2017 9:13 AM UTC
Editor's Picks


- Market Data
Most Popular


