


 ETH Cracks $2,100 in Bitcoin’s Wake as Bearish EMA Stack Deepens; Sellers Target $1,900 on Rallies
  Ether Breaks Below $2,100: Triple EMA “Sell-the-Rally” Setup Targets $1,900
  Bitcoin Bleeds $704M in ETF Outflows as Institutional Exodus Accelerates
  FxWirePro- Major Crypto levels and bias summary
  Bitcoin Buckles at $73,500: Middle East Tensions and Weak Institutional Demand Set Bearish EMA Stack on $70K Collision Course
  Ethereum Tumbles Below $2K: Bears Eye $1,700 as All Key EMAs Flip Red


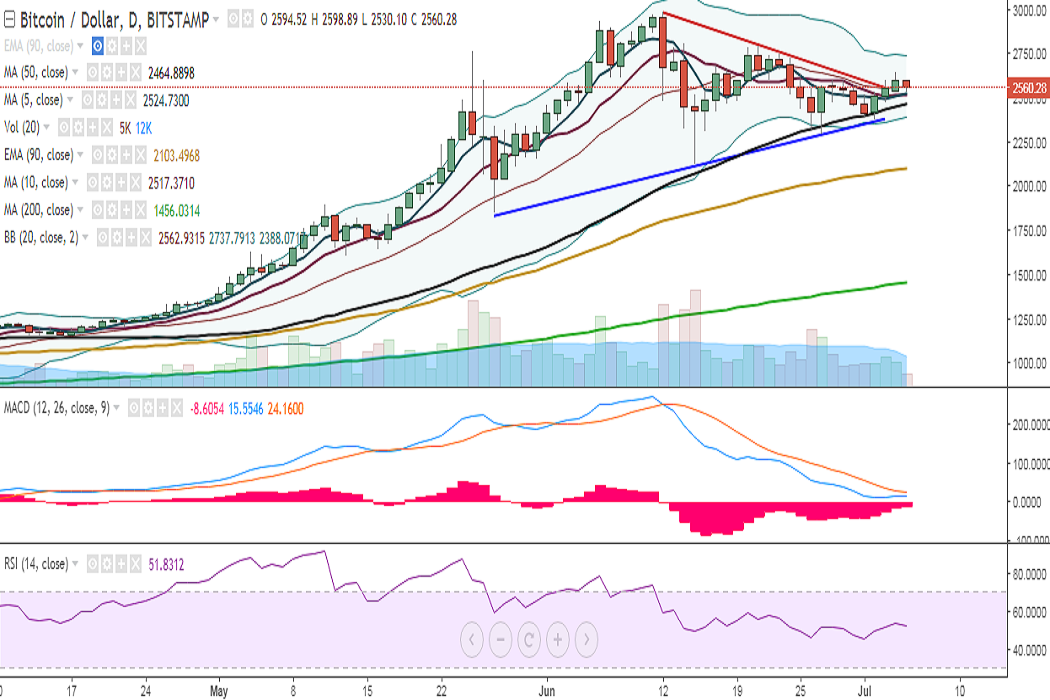
BTC/USD broke above the major trend line resistance joining 2980 and 2789 to hit 2639 levels on Tuesday. However, it failed to hold its strength and has slipped below the 2600 levels. It is currently trading at 2548 levels at the time of writing (Bitstamp).
Ichimoku analysis of daily chart:
Tenkan Sen: 2465.23
Kijun Sen: 2550
On the upside, the pair now faces resistance at 2614 (4h 200-SMA) and a consistent break above would target 2651 (61.8% retracement of 2980 and 2120)/2682 (78.6% retracement of 2789 and 2291). Further strength would see it testing 2760 (May 25)/ 2789 (June 21 high)/2853.
On the downside, support is seen at 2515 (10-DMA) and any violation would target 2490 (trend line joining 2980 and 2789)/2464 (cloud top). Further weakness would drag it to 2451 (cloud top)/2403 (trend line joining 1850 and 2120).
Momentum studies: On the daily chart, RSI is at 54, with lower bias; MACD line is below the signal line with waning downward momentum; stochs are slightly biased higher. Moreover, the narrowing of the Bollinger bands suggests an upcoming change of trend.
Recommendation: Wait for clear directional bias.
FxWirePro launches Absolute Return Managed Program. For more details, visit http://www.fxwirepro.com/invest


