


 FxWirePro- Major Crypto levels and bias summary
  FxWirePro- Major Crypto levels and bias summary
  FxWirePro- Major Crypto levels and bias summary
  Bitcoin Cracks $75K as $1.3B ETF Exodus and Middle East Jitters Spook Bulls; Bears Eye $70K
  ETH Cracks $2,100 in Bitcoin’s Wake as Bearish EMA Stack Deepens; Sellers Target $1,900 on Rallies
  Bitcoin Bleeds $704M in ETF Outflows as Institutional Exodus Accelerates
  Bitcoin Buckles at $73,500: Middle East Tensions and Weak Institutional Demand Set Bearish EMA Stack on $70K Collision Course
  Ethereum Cracks Below $2,000 as Bitcoin Contagion Bites—Bearish EMA Stack Sets Sights on $1,700


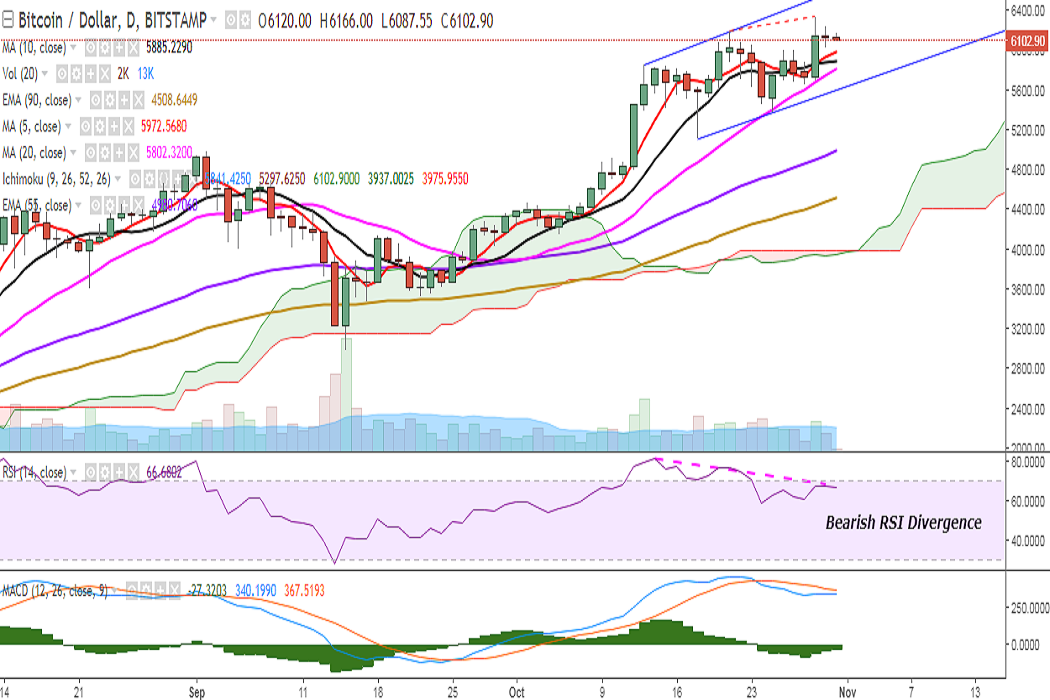
BTC/USD is trading in a close range on Tuesday at 6142 levels at the time of writing (Bitstamp).
Ichimoku analysis of daily chart:
Tenkan Sen: 5841.42
Kijun Sen: 5297.62
Resistance is seen at 6220 (161.8% retracement of 4979.90 and 2972.01) and a break above would target 6285 (113% retracement of 6180 and 5366)/6316 (October 29 high). Further strength would see it testing 6348 (trend line joining 6180 and 6316)/ 6401.
On the flipside, short-term support is seen at 6123 (2h 20-SMA) and a break below would see it testing 6052 (1h 50-DMA)/5981 (5-DMA). Further weakness would drag it to 5889 (10-DMA)/5804 (20-DMA)/5773 (2h 200-SMA)/5705 (1w 5-SMA)/5646 (October 28 low)/5598 (trend line joining 5101.01 and 5366).
Momentum studies: On the daily chart, RSI is holding at 67 and stochs are on the verge of a rollover to the overbought zone. However, caution is advised as bearish RSI divergence and MACD line below the signal line could be seen. The narrowing of the Bollinger bands suggests an upcoming change in trend.
The pair has found strong support at 20-DMA and only a consistent break below would confirm trend reversal.
FxWirePro launches Absolute Return Managed Program. For more details, visit http://www.fxwirepro.com/invest

- News

- Economy

- Central Banks
- Investing
- Research
- Roundups
- Digital Currency
- Insights
- Technical Analysis
- Technology
- Business
- Law
- Health
- Nature
- Fintech
- Science
- Topic
- Opinions
- ©Econometrics LLC . All Rights Reserved.
FxWirePro: BTC/USD rangebound, weakness only on break below 20-DMA
Tuesday, October 31, 2017 6:59 AM UTC
Editor's Picks


- Market Data
Most Popular


