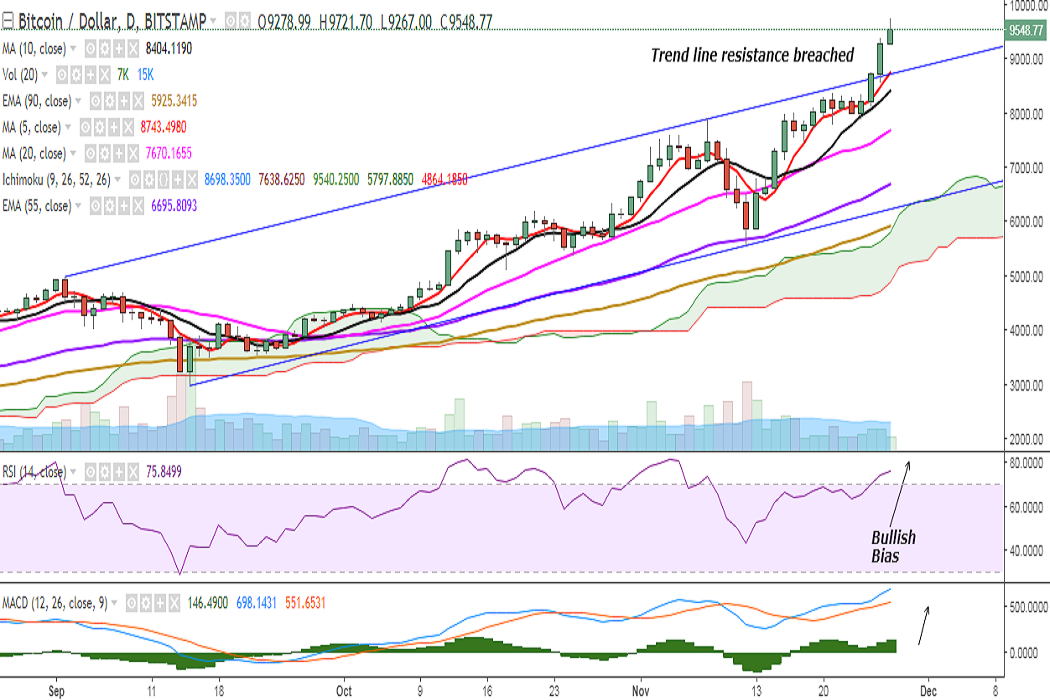
BTC/USD surged higher on Monday as it broke above the trend line joining 7888 and 8354. It has hit a fresh all-time high at 9721 so far in the day and is currently trading at 9550 levels at the time of writing (Bitstamp).
Ichimoku analysis of daily chart:
Tenkan Sen: 8698.35
Kijun Sen: 7638.62
On the upside, resistance is seen at 9862 (113% extension of 5555.55 and 9366.60) and a break above would target 10000/10200 (200% retracement of 7888 and 5555.55). Further strength would see it testing 10403/10500.
On the flip side, support is seen at 9381 (1h 20-SMA) and a break below would drag the pair to 9241 (3h 10-SMA)/9136 (4h 10-SMA)/9000. Further weakness would see the pair testing 8983 (1h 50-SMA)/8742 (5-DMA)/8710 (trend line joining 7888 and 8354).
Momentum studies: Bias remains bullish on the daily chart with no signs of reversal – RSI strong at 75, MACD line above the signal line, and major moving averages biased higher. However, cautions is advised as stochs are in the overbought zone.
FxWirePro launches Absolute Return Managed Program. For more details, visit http://www.fxwirepro.com/invest