


 FxWirePro:NZD/USD remains vulnerable as Trump's latest deadline leaves investors on edge
  FxWirePro- Woodies Pivot(Major)
  FxWirePro- Major European Indices
  FxWirePro- Major Pair levels and bias summary
  FxWirePro: NZD/USD neutral in the near-term, scope for downward resumption
  FxWirePro: EUR/ NZD consolidating around 2.0200, room for further gains
  FxWirePro- Major European Indices
  FxWirePro: USD/JPY holds range near 160 as intervention risks loom
  Aussie Ascent: AUDJPY Charges Toward 112 as Bullish Momentum Hits Five-Day High
  FxWirePro: USD/CNY drifts lower, vulnerable to more downside
  Bitcoin Resilience: BTC Reclaims USD 69,000 as Geopolitical Tensions Ease
  FxWirePro: EUR/ NZD consolidating around 2.0180 room for further gains
  Ethereum Joins the Rally: ETH Reclaims USD 2,100 Following Bitcoin's Lead
  FxWirePro: AUD/USD slips amid wavering risk sentiment
  FxWirePro: AUD/USD recovers slightly from early decline but bears are not done yet


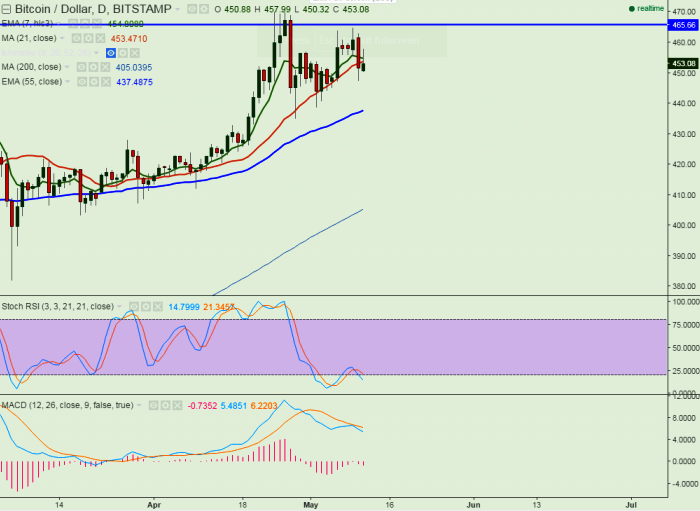
- Major resistance -$470 (Apr 26th 2016)
- BTC/USD has once declined till $447 after making a high of $464.79.It is currently trading around $453.
- Short term trend is bullish as long as support $435 holds
- The pair’s major support - $435 (55 day EMA) and any slight weakness can be seen only below $435.
- Any break below $435 will drag the pair down till $420 (55 day EMA)/$385 (200 day EMA).The minor support is around $453(7 day EMA)/$440.
- On the higher side resistance is at $470 and any indicative break above targets $504/$550.
It is good to buy at dips around $445 with SL around $434 for the TP of $480/$504/$550.


