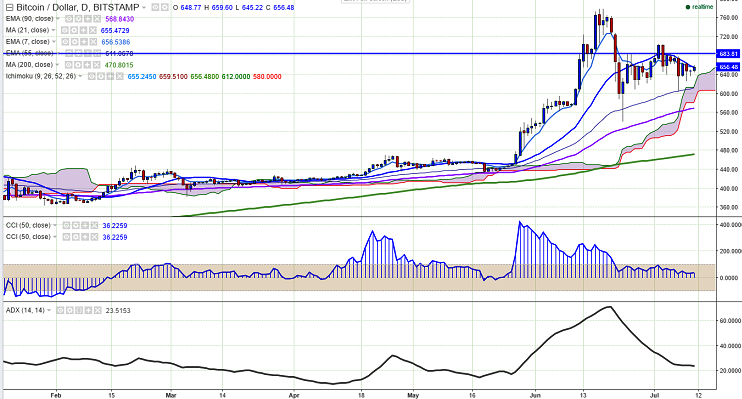
BTC/USD remained largely stable following the halving of the bitcoin mining rewards. The pair’s uptrend seems to be still limited by 21 MA. It currently trades at 648.06 levels (Bitstamp), after hitting a high of 659.60 levels so far in the day.
Ichimoku analysis (Daily Hour chart):
Tenkan-Sen level: $655
Kijun-Sen level: $659
Trend reversal level - (90 4H EMA)-$661.53
“The pair has slightly declined after making a high of $665.99. BTC/USD has taken support near (55 day EMA) and slightly jumped from that level. It should break below $600 for further weakness”, FxWirePro said in a statement.
Both long- and short-term trend appear bullish and major resistance is around $659 (21 day MA) and any break above targets $685 (Jun 25 high)/$705 (Jul 2 nd high)/ $731 (161.8% retracement of $778 and $540). Short term support – $605 (55 day EMA) and any violation below will drag the pair till $540 (Jun 23 rd low)/$514 (113% retracement of $540 and $705).