


 FxWirePro- Major Crypto levels and bias summary
  BTC’s Bear Bounce: Sell the Rally Near $66K as Bears Target $59K–$52K Breakdown
  FxWirePro- Major Crypto levels and bias summary
  FxWirePro- Major Crypto levels and bias summary


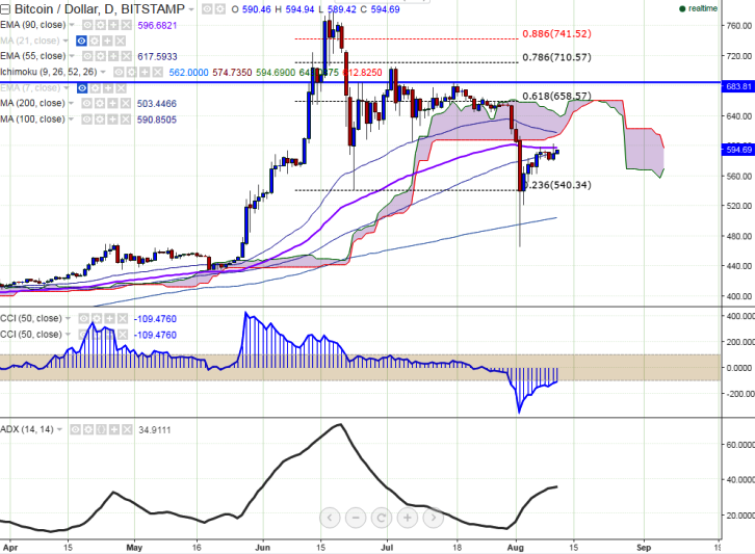
BTC/USD has declined after jumping till $603 yesterday. It is currently trading at $593 (Bitstamp).
Long-term trend: bullish
Ichimoku analysis (Daily chart):
Tenkan-Sen level: $539
Kijun-Sen level: $574.73
Trend reversal level - (90 EMA)-$596.72
“The pair is facing strong resistance at $597 (90 day EMA) and close above that level confirms minor bullishness”, FxWirePro said in a statement.
Major resistance is around $597 (90 day EMA) and any break above targets $622 (21 day EMA)/$658 (61.8% retracement of $778 and $465). Short-term support is seen at $574 (daily Kijun-Sen) and any violation below targets $540 (38.2%retracement of $465 and $583)/ $500 (200 day MA).

- News

- Economy

- Central Banks
- Investing
- Research
- Roundups
- Digital Currency
- Insights
- Technical Analysis
- Technology
- Business
- Law
- Health
- Nature
- Fintech
- Science
- Topic
- Opinions
- ©Econometrics LLC . All Rights Reserved.
FxWirePro: BTC/USD struggles to close above 600, good to buy on dips
Thursday, August 11, 2016 7:03 AM UTC
Editor's Picks


- Market Data
Most Popular


