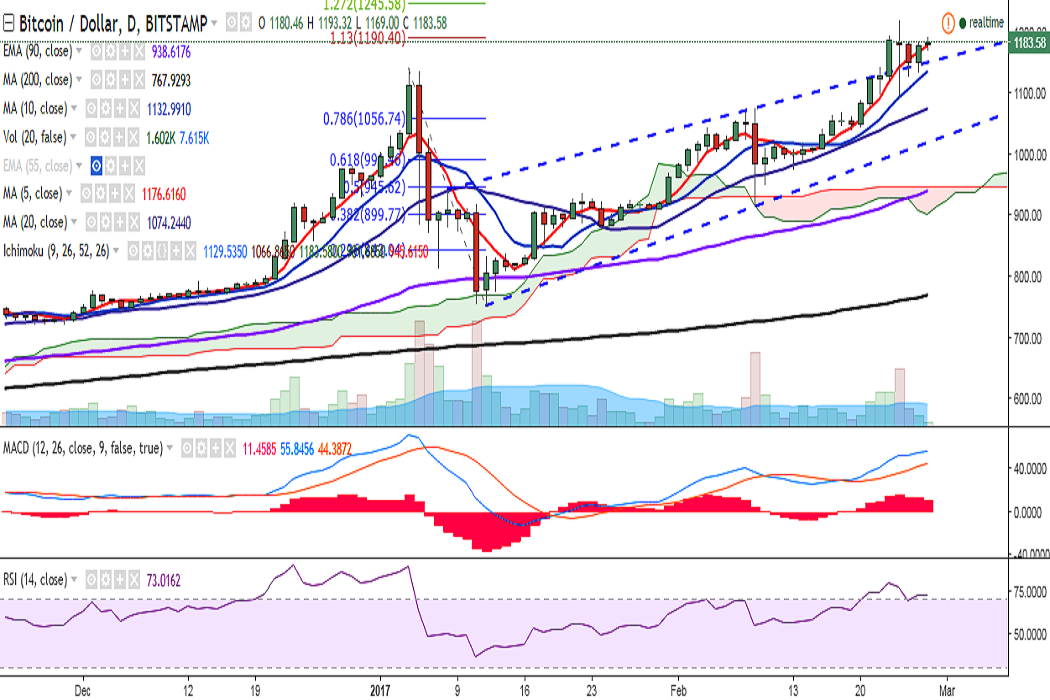
BTC/USD is once again inching closer to the 1200 mark and is currently trading at 1185 levels at the time of writing (Bitstamp).
Ichimoku analysis of daily chart:
Tenkan Sen: 1129.53
Kijun Sen: 1066.86
Following the recent plunge to 1091 levels (February 24), the pair has been gradually moving up. The 20-DMA support still holds and the pair is currently trading above 5-DMA.
In the 1H and 4H charts, the price movement appears to be in a close range, with narrowing of Bollinger bands. This suggests that some consolidation could be seen around current levels.
Overall trend appears bullish. On the upside, immediate resistance is seen at 1200 (psychological) and a break above would target 1220 (February 24 high)/1245 (127.2% retracement of 1139.89 and 751.34).
However, some caution is advised as stochs and RSI(14) are in the overbought zone.
On the reverse side, support is seen at 1165.90 (5-DMA) and any violation would see it testing 1120 (10-DMA)/1067.68 (20-DMA).