


 Ethereum Cracks Under $1,700: Sell the Rally Near $1,750 as Bears Eye $1,380–$1,200
  FxWirePro- Major Crypto levels and bias summary
  BTC’s Bear Bounce: Sell the Rally Near $66K as Bears Target $59K–$52K Breakdown
  FxWirePro- Major Crypto levels and bias summary


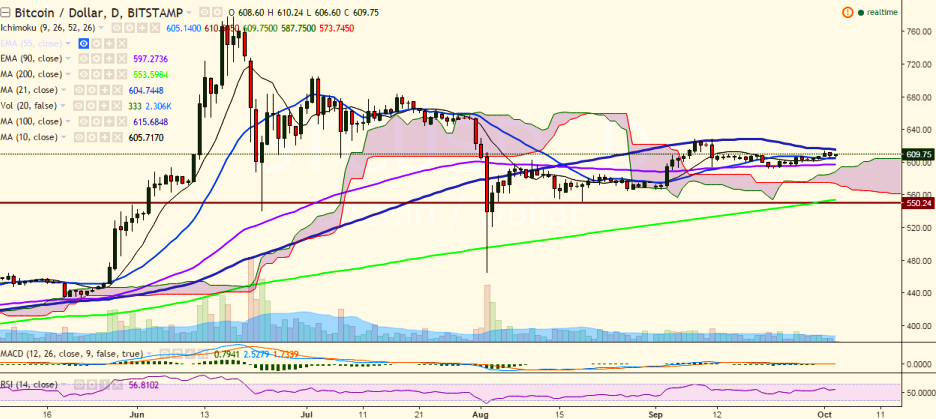
BTC/USD is showing a small dip after it hit 614.28 levels on 1st October. It is currently trading at 609 levels (Bitstamp).
Long-term trend: Bullish
Short-term trend: Bullish
Ichimoku analysis of daily chart:
Tenkan Sen: 605.14
Kijun Sen: 610.54
Trend reversal: 596.99 (90 EMA)
“The pair has failed to break above 616.71 (100-day MA) and seems to have taken support near 21-day MA. Short-term trend appears bullish and a break above 100-DMA targets 630”, FxWirePro said in a statement.
Major resistance is seen at 616.71 (100-day MA) and a break above would see the pair testing 628.99 (September 11 high) and then 651.79 (161.8% retracement of 628.99 and 592.10).
On the downside, the pair has taken support near 604.66 (21-DMA) and any violation would drag the pair to 600 (psychological levels)/ 596.99 (90 EMA)/ 578.39 (161.8% retracement of 592.10 and 614.28).

- News

- Economy

- Central Banks
- Investing
- Research
- Roundups
- Digital Currency
- Insights
- Technical Analysis
- Technology
- Business
- Law
- Health
- Nature
- Fintech
- Science
- Topic
- Opinions
- ©Econometrics LLC . All Rights Reserved.
FxWirePro: BTC/USD takes support near 21-DMA, good to buy on dips
Monday, October 3, 2016 7:38 AM UTC
Editor's Picks


- Market Data
Most Popular


